
Generator set partial load fuel is the litres-per-hour curve that rises less than the load, so the litres-per-kWh figure is worst at light load and best at full. Tesla Power reads the four points below from a 400kVA set and warns a buyer whose load rarely reaches half. This guide works the figures before you request a quotation.
- At 25% load a set burns roughly half the full-load figure, so each kWh costs about twice as much fuel.
- The engine runs below its best temperature at light load, which also invites wet stacking.
- Compare litres per kWh, not litres per hour, when two engines claim the same efficiency.
- Send the load profile, not the peak, and the frames in the export frame range are matched to the duty.
What does the partial load fuel curve look like?
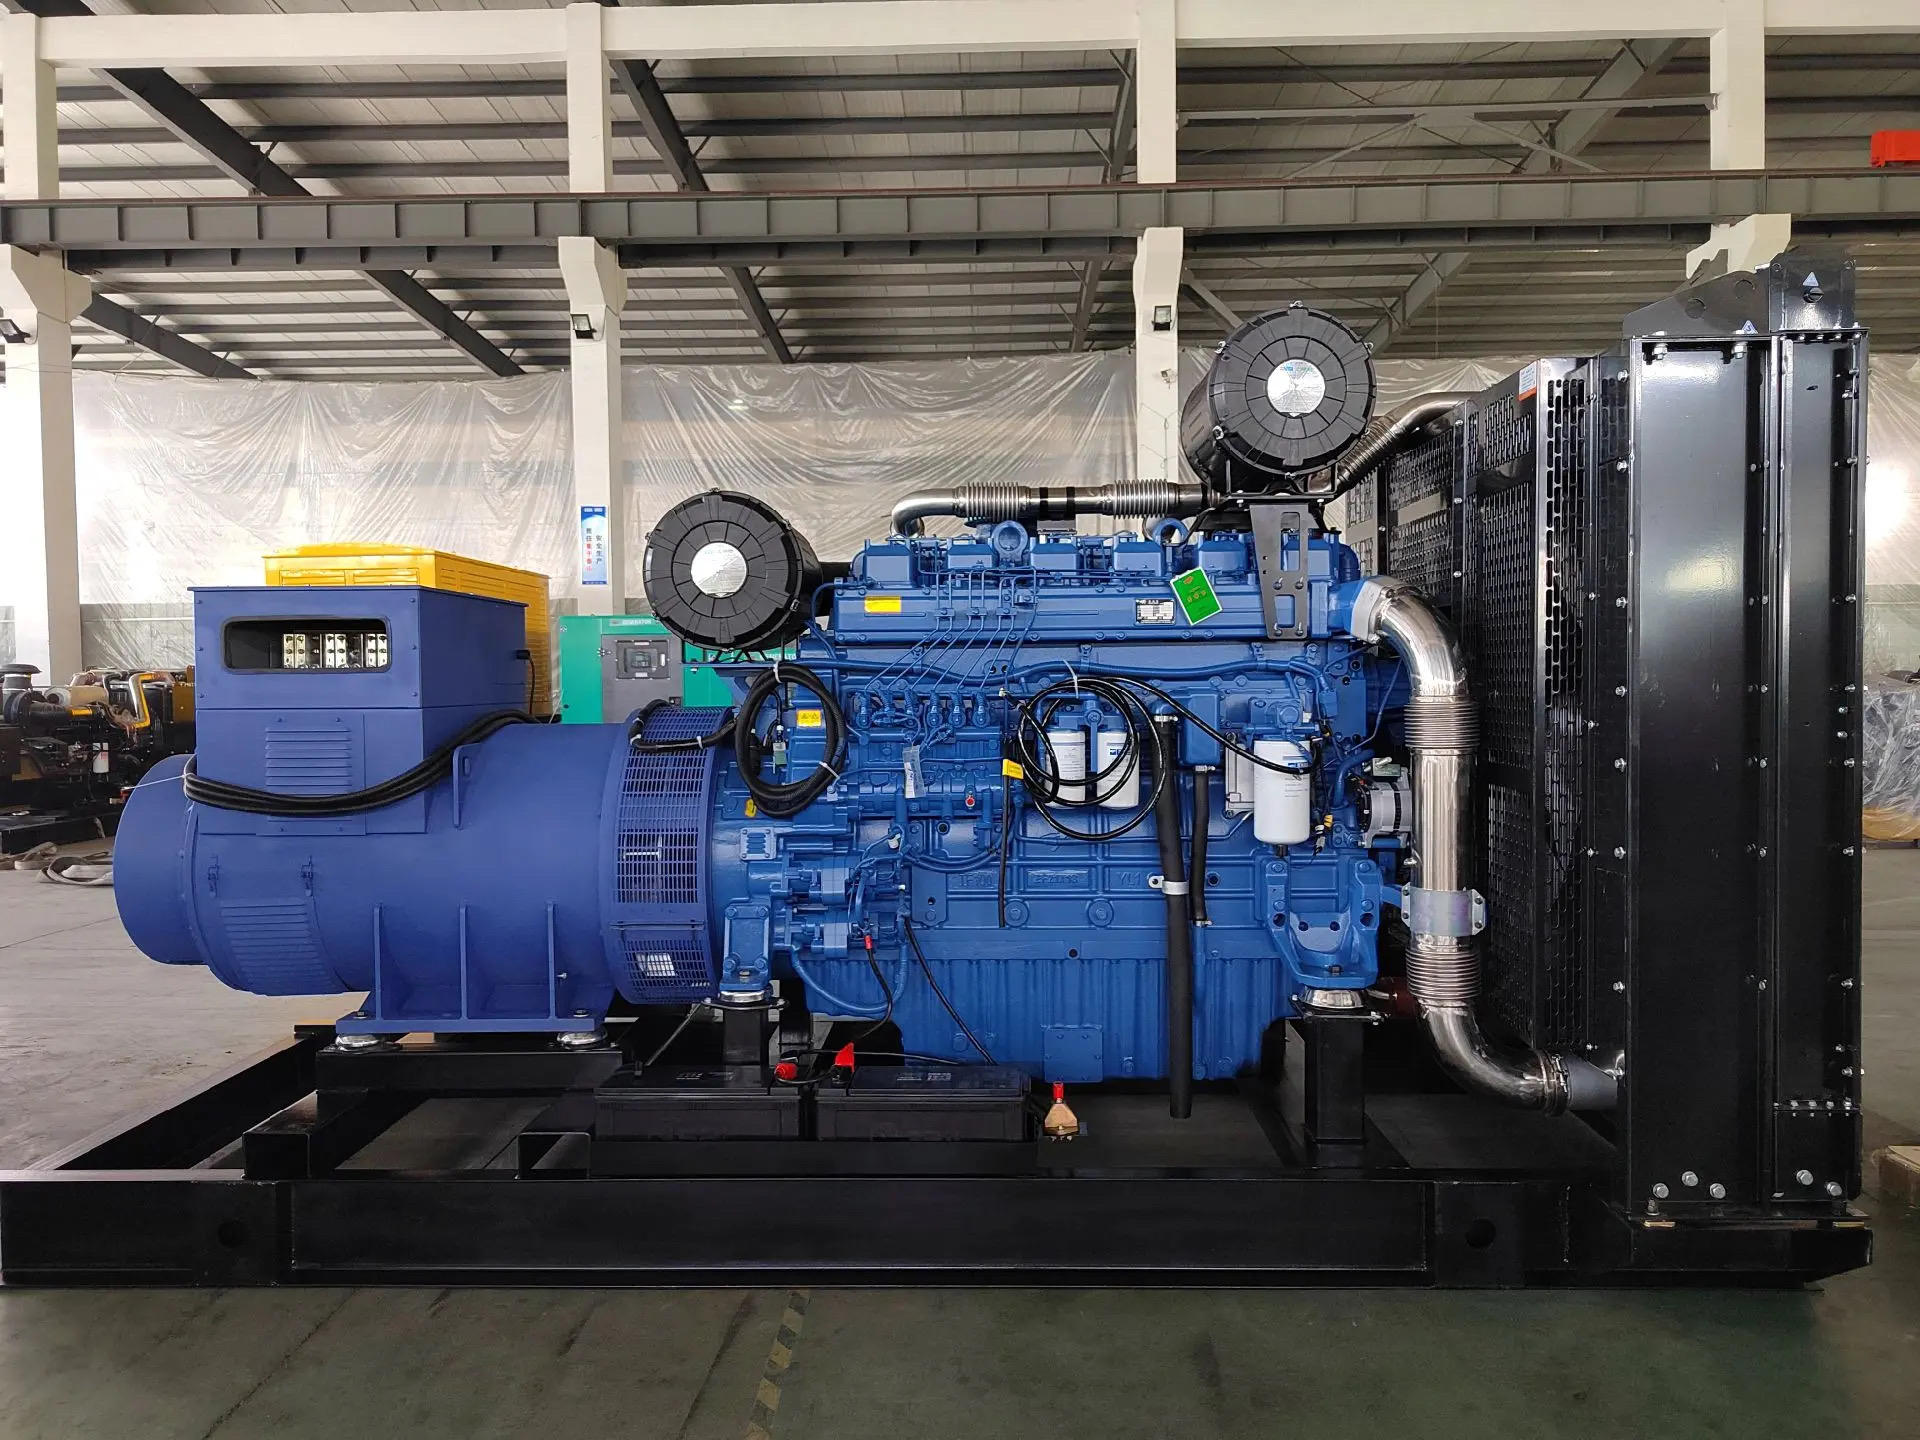
The curve is not a straight line. Most generator manufacturers print only the full-load figure, and Chinese generator suppliers rarely send the four-point curve. A 400kVA frame at 0.8 power factor carries 320kW, and its fuel burn at four load points reads 25% at 20 L/h, 50% at 35 L/h, 75% at 51 L/h and 100% at 67 L/h. The engine uses far less fuel at light load, and it uses much more fuel per unit of output, because the losses stay roughly constant while the output falls. Tesla Power writes the figure into the offer line so the basis travels with it.
Work the per-kWh figure on the consumption basis in the ISO 3046-1 reference and the point becomes clear. At 25% the output is 80kW and the burn is 20 L/h, so the specific figure is 20 ÷ 80 = 0.25 L/kWh. At 100% the output is 320kW and the burn is 67 L/h, so the figure is 67 ÷ 320 = 0.21 L/kWh. The efficiency gap between light and full load is about 0.04 L/kWh on this engine.
Why is the per-kWh figure worse at light load?
Because the fixed losses do not shrink with the load. The cooling fan, the alternator's magnetic losses, the oil pump and the friction of the running gear all take their share whether the set makes 80kW or 320kW, and at light load that fixed share is a larger fraction of the output. A set at 25% load pays for a full engine to make a quarter of its power.
There is a second effect in the combustion itself. A lightly loaded engine runs cooler, and a cooler chamber burns the fuel less completely, so some of the energy leaves as unburned hydrocarbons and soot rather than as torque. The two effects together are why the specific figure at 25% is the worst on the curve, and why a set chosen too large is quietly expensive. A generator for a site that idles needs this curve more than a prime set does.
| Load | Output | Burn rate | Specific fuel |
|---|---|---|---|
| 25% | 100kVA | 20 L/h | 0.25 L/kWh |
| 50% | 200kVA | 35 L/h | 0.22 L/kWh |
| 75% | 300kVA | 51 L/h | 0.21 L/kWh |
| 100% | 400kVA | 67 L/h | 0.21 L/kWh |
How does light load cause wet stacking?
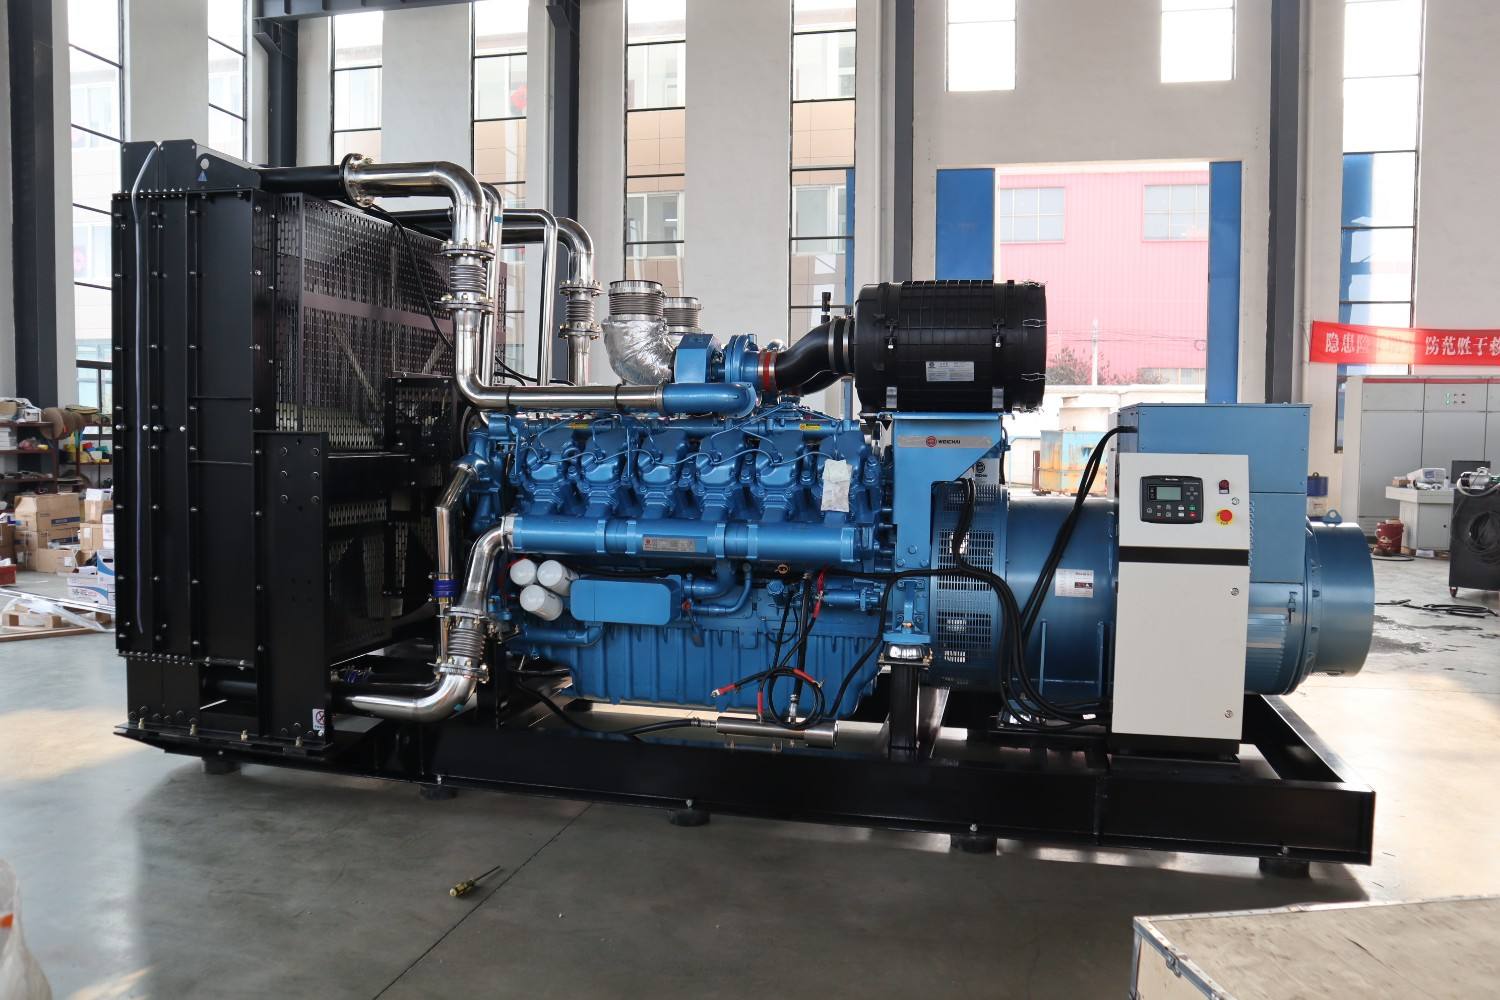
Wet stacking is the deposit of unburned fuel and soot in the exhaust when the engine runs cool for long periods. Below about 30% load the combustion chamber does not reach the temperature that burns the heavier fractions, and they condense on the valve stems and the turbo. The deposit builds slowly and clears quickly, but a set that runs at 25% for years does not clear it. Yangzhou Tesla Power states the ambient and the altitude beside the rating.
The symptom is black oil at the exhaust and a gradual loss of compression, and the fix is a load bank run at 75% or more for two hours. A set that cannot be load banked needs the load profile changed or a smaller frame, because the light-load fuel figure is only half of the problem the deposits represent. The 400kW frame on the WP13 platform carries that curve on its data sheet.
Which loads waste the most fuel per kWh?
The loads below half, and the idle load above all. A set that runs unloaded between duty cycles burns fuel at the idle figure of about 9 L/h on a 330kVA frame, which is 100% waste in terms of output. A site with a long idle period each day spends more on that idle than on any other part of the duty cycle.
Two behaviours compound it. The first is a set sized for a peak that arrives for two hours a year, which then runs at 20% the rest of the time. The second is a control system that holds the set on idle instead of shutting it down, because a restart is feared more than the idle fuel. Both are fixed by the load profile, not by the engine. A generator for standby duty runs light between tests, so the curve is the figure a maintenance plan is written around. Tesla Power reads that figure on the site sheet before the plate is printed.
How is the curve used to size a frame?
Size the frame so the site's typical load sits between 50% and 80%, not at 20%. That band is where the per-kWh figure is close to its best and the engine is warm enough to stay clean. A site that expects 120kW should carry a 200kVA frame rather than a 500kVA one, because the 200kVA frame runs at 65% of its rating while the 500kVA one runs at 26%.
The trade-off is the peak. A 500kVA frame accepts the 400kW peak that the 200kVA frame cannot, and a buyer then has to choose between running light all year or starting a second set for the peak. That is a load management question rather than a fuel question, and the answer belongs in the enquiry rather than in the parts book.
What does a partial load run do to the engine?
It keeps the oil below its working temperature, and the oil then holds more water and acid. It keeps the aftertreatment, where one is fitted, below its regeneration temperature, so the filter loads up. It lets the rings lose their seal, and the engine begins to use oil. The fuel figure is the first symptom and the ring wear is the last.
The manufacturer's service interval assumes a certain load, and a set run permanently light needs the oil changed on hours rather than on the calendar. A genset at 25% load for 200 hours a year is not the same machine as one at 75%, even though the hour meter reads the same. That difference is what a duty class and a load profile exist to record. A generator in a cold store runs light in the off season, which is why the oil interval follows the load rather than the hours.
How should a buyer compare two engines on fuel?
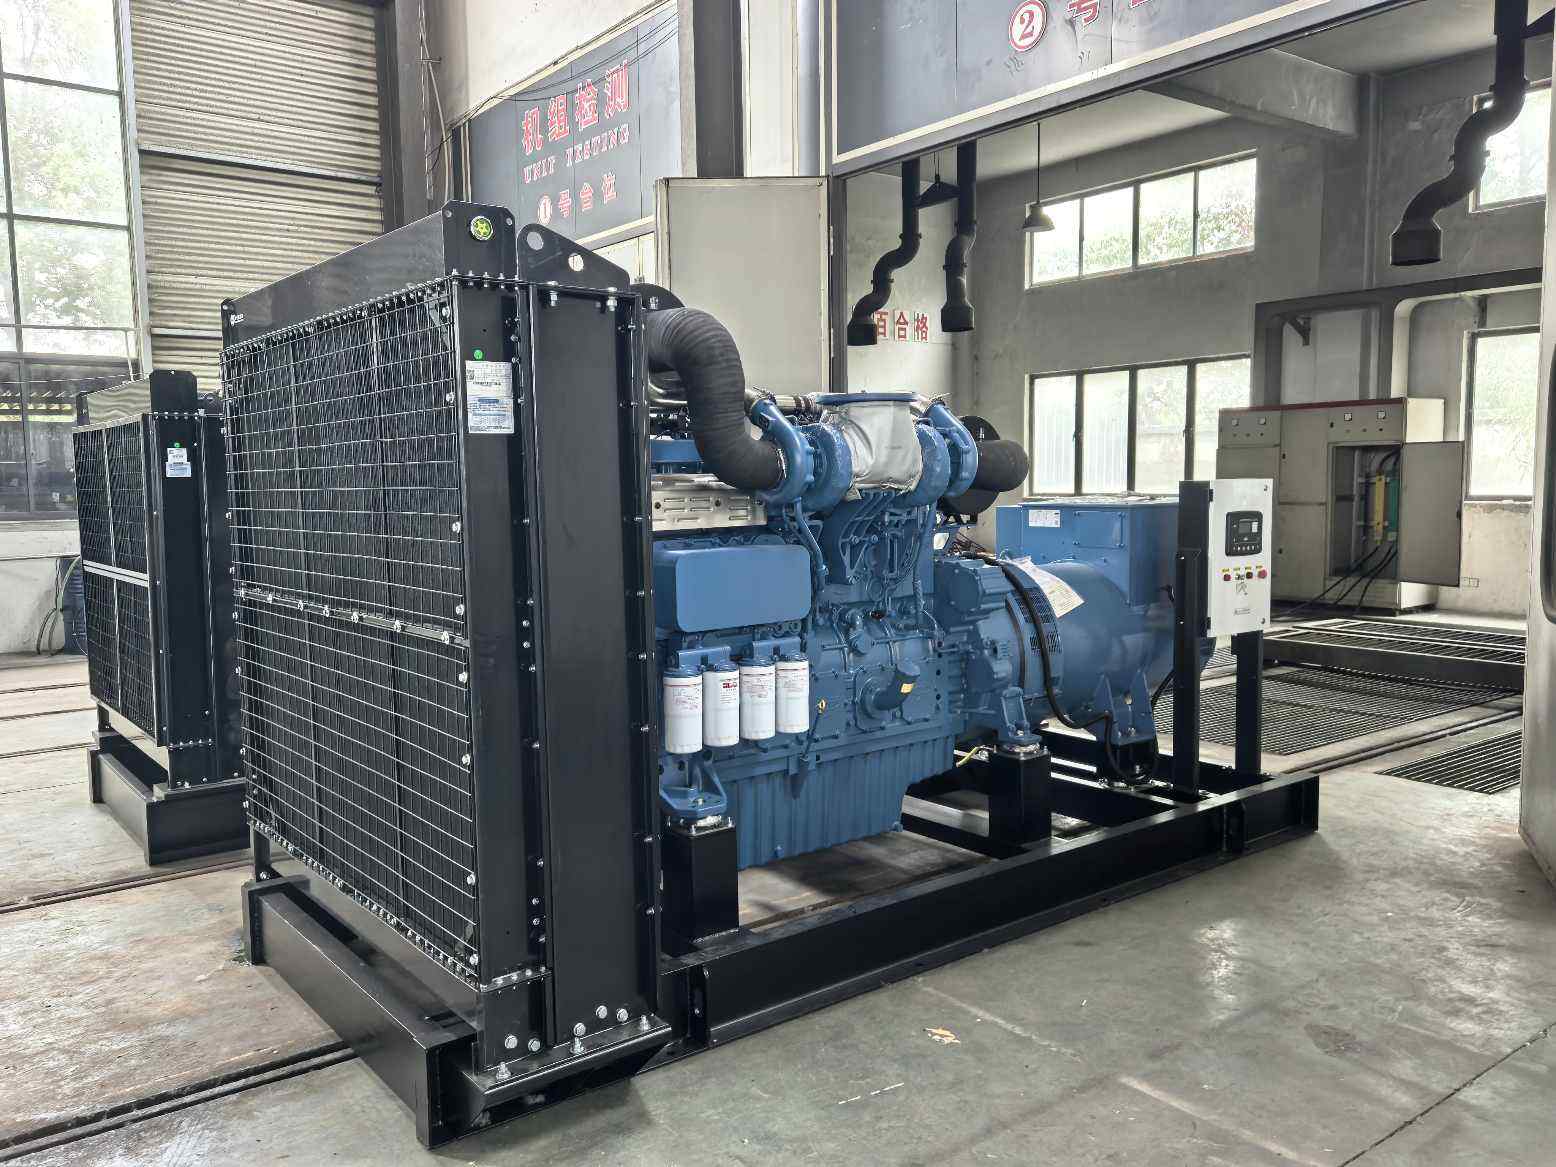
Compare litres per kWh at the load the site will actually run, not the published litres per hour at full load. A full-load figure is the one every data sheet prints, and it flatters an engine whose curve is steep at the top. The per-kWh figure at 50% and 75% is the honest comparison, and it is the two points a buyer should ask for.
Ask for the curve as a table rather than as a single number. A supplier who sends a single full-load figure may have nothing to hide, and a supplier who sends the four points can be checked against a second offer on the same basis. The curve is the fuel equivalent of the derating chart, and it belongs on the same page of the file.
What does the factory record on the fuel curve?
Our test bay measures the burn at 25%, 50%, 75% and 100% on a calibrated meter and records the four points beside the load. The meter is corrected for temperature, because a fuel figure taken on a cold morning reads differently from one taken after a two-hour run. Tesla Power Equipment files the four points with the test sheet, and they travel with the set.
The curve is also the check a warranty claim leans on. A site that reports high consumption is asked for its own metered figure at a known load, and the two curves are compared. A set burning 0.29 L/kWh at 25% is healthy, and the same set burning 0.34 L/kWh at 25% has a fault, which is why the baseline matters.
How should the enquiry state the load profile?
State four items: the typical load in kW, the minimum sustained load, the peak and how long it lasts, and the idle hours in a week. The four decide whether the set runs in the efficient band or lives at light load, and they decide whether a smaller frame plus a second set is the cheaper route.
Send the four with the load list to the export desk, and the reply carries the fuel curve at the site's actual load rather than at the plate. The site planning notes carry the same four items as a form, and Tesla Power plots the curve on the offer so the figure is visible before the order. The factory and the test bay keep the measured curve in the order file.
What does light-load fuel cost over a year?
Work a real year at 400kVA. A site running 2,000 hours at 25% load burns 20 × 2,000 = 40,000 L, and at 75% load for the same hours it burns 51 × 2,000 = 102,000 L for four times the output. The light-load site produces 160,000 kWh and the heavier site produces 480,000 kWh, so the lighter site spends 0.25 L/kWh against 0.21 L/kWh.
That gap of 0.04 L/kWh over 160,000 kWh is 6,400 L a year, and at a fuel price of 1.00 per litre it is a small annual figure that compounds over the life of the set. The larger cost is the wet stacking and the shorter service life, which the fuel figure only hints at. A genset matched to its load avoids both. Tesla Power keeps the reading beside the load record rather than in a covering letter. The same frame appears in the 500kVA silent set with the ATS option, where the plate states the same basis.
Frequently asked questions about generator set partial load fuel
About 30% of rating for a modern engine and 40% for an older one, sustained over hours. Below that the deposits begin and the per-kWh figure worsens sharply. A set that cannot reach 30% needs a smaller frame or a load bank.
It leaves the turbo below its efficient speed and the oil pressure at idle is lower, which is the harder condition for the bearings. The damage is slow and shows as oil at the compressor inlet. Regular full-load runs clear the deposits and keep the seals working.
It is the extreme of the curve, and it is all waste. A 400kVA set at idle burns about 9 L/h with no output. Sites that idle for long periods should shut down or fit a smaller support set for the overnight load.
Divide the burn in litres per hour by the output in kilowatts at the same load point. The result is litres per kilowatt-hour, and it is the figure to compare rather than the raw burn. Lower is better, and it varies with load.
Because it is the flattering figure and the one a buyer usually asks for. The honest answer is the four-point curve, and a supplier who provides it has nothing to hide. Ask for the curve rather than the single number.
The rating is fixed, but the engine can be exercised at full load on a schedule to keep it clean. That is a maintenance plan rather than a re-rating. A site that runs light should load bank monthly, which is what the duty class documentation and the monthly run in the NFPA 110 routine record between them.
It changes slightly because the engine loses air and the smoke limit moves, and the per-kWh figure at light load stays roughly the same. The dominant effect on the curve is the load, not the altitude. Correct the output first, then read the curve.
The generator set CE marking requirements sit in the technical file, and the fuel curve is part of the engine data sheet within that file. Conformity assessment for the assembly does not test the curve itself. Tesla Power keeps the measured curve in the same folder as the declaration.