
A genset overheating problem rarely announces its cause, so the fastest way to diagnose it is to trace the set in a fixed order rather than to guess at parts. We write this trace from the test floor at Tesla Power, where every export set runs a load test before it ships and where that test log becomes the baseline a site reading is compared against. The order is coolant first, then the air that reaches the radiator, then the load side, then the timing of the rise inside the run. Each step either finds the fault or clears a whole group of causes. A 500kVA frame carries 400kW at 0.8 power factor, and heat removes part of that figure before the first site load lands. Keep the record tidy and the quotation you request afterwards becomes a comparison between two measured figures instead of a debate. The same record decides which supplier can answer in one reply.
- Check the coolant level cold and the radiator face first, because most traces end at these two checks rather than inside the engine.
- Measure the air temperature at the enclosure intake, not the shade figure in the yard, before the load side is blamed.
- Log coolant temperature, load figure and clock time together, because the timing of the rise separates an airflow fault from a fouled core.
- Read the causes list behind a hot-running set before you test, so the order of checks follows the cheapest circuit first.
What does a genset overheating problem show on the controller?
The controller writes the case before anyone opens a panel. A coolant line that climbs 2 to 3 degrees a minute points at heat leaving slower than the engine makes it. A line that sits 8 to 10 degrees above the yard for a whole afternoon points at air arriving warm. Read both figures against the load line rather than on their own.
Most controllers raise a pre-alarm about 5 degrees below the shutdown point, which sits near 98 to 102 degrees Celsius on an export set. The pre-alarm is the useful line. It is crossed while the set still runs and while the trace can be walked in order. A shutdown that arrives without any pre-alarm in the history suggests a sensor or a wiring fault, not a slow thermal climb, and it changes where the trace starts.
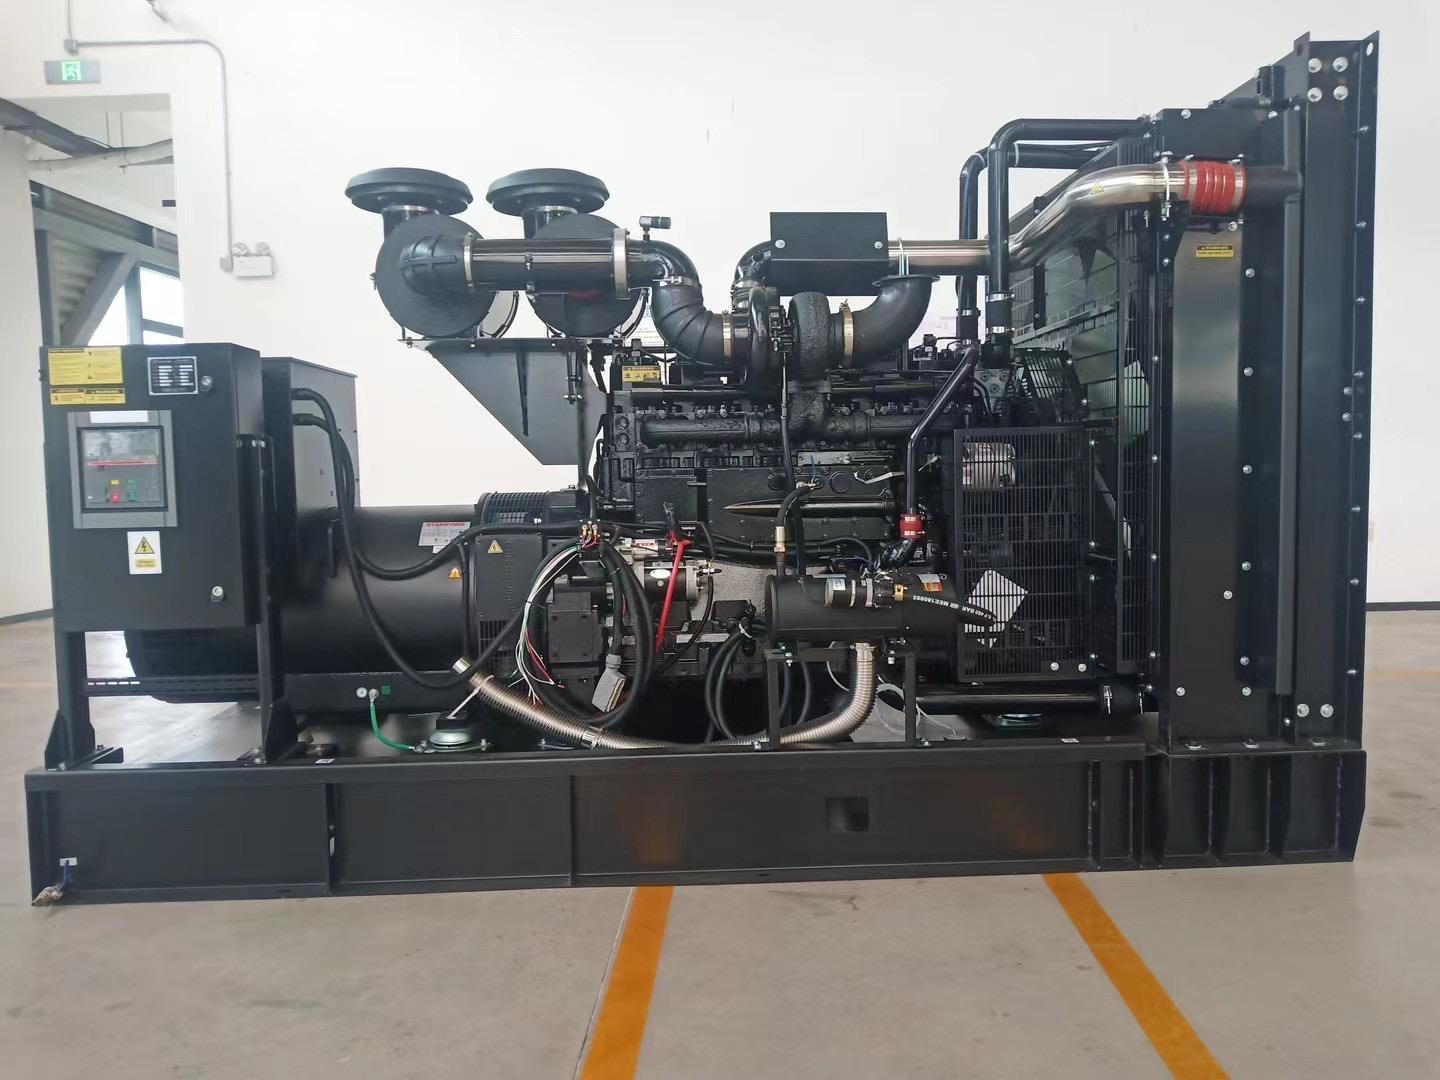
A genset overheating problem for standby sets shows the same three patterns, which is why the trace order does not change with the duty. The duty changes how often the pattern repeats, and how much history the log holds.
Why does the coolant circuit start the trace?
Coolant comes first because the jacket removes roughly half the fuel energy a diesel releases, and because every check on the circuit costs minutes rather than days. The table below puts the checks in the order a trace follows on site, from the level glass to the clock.
| Order | Circuit | Check at the set | What it clears or convicts |
|---|---|---|---|
| 1 | Coolant | Level read cold at the expansion tank | Low level, air lock, slow leak |
| 2 | Coolant | Radiator face and core with a torch | Fouling, blocked fins, recirculated air |
| 3 | Coolant | Pressure cap tested against its rating | Wrong cap figure, weak seal |
| 4 | Coolant | Thermostat start and full stroke | Stuck or part-stroking valve |
| 5 | Air | Intake temperature against the yard figure | Hot recirculation, louvre shortfall |
| 6 | Load | Load figure against the derated rating | Running above the corrected figure |
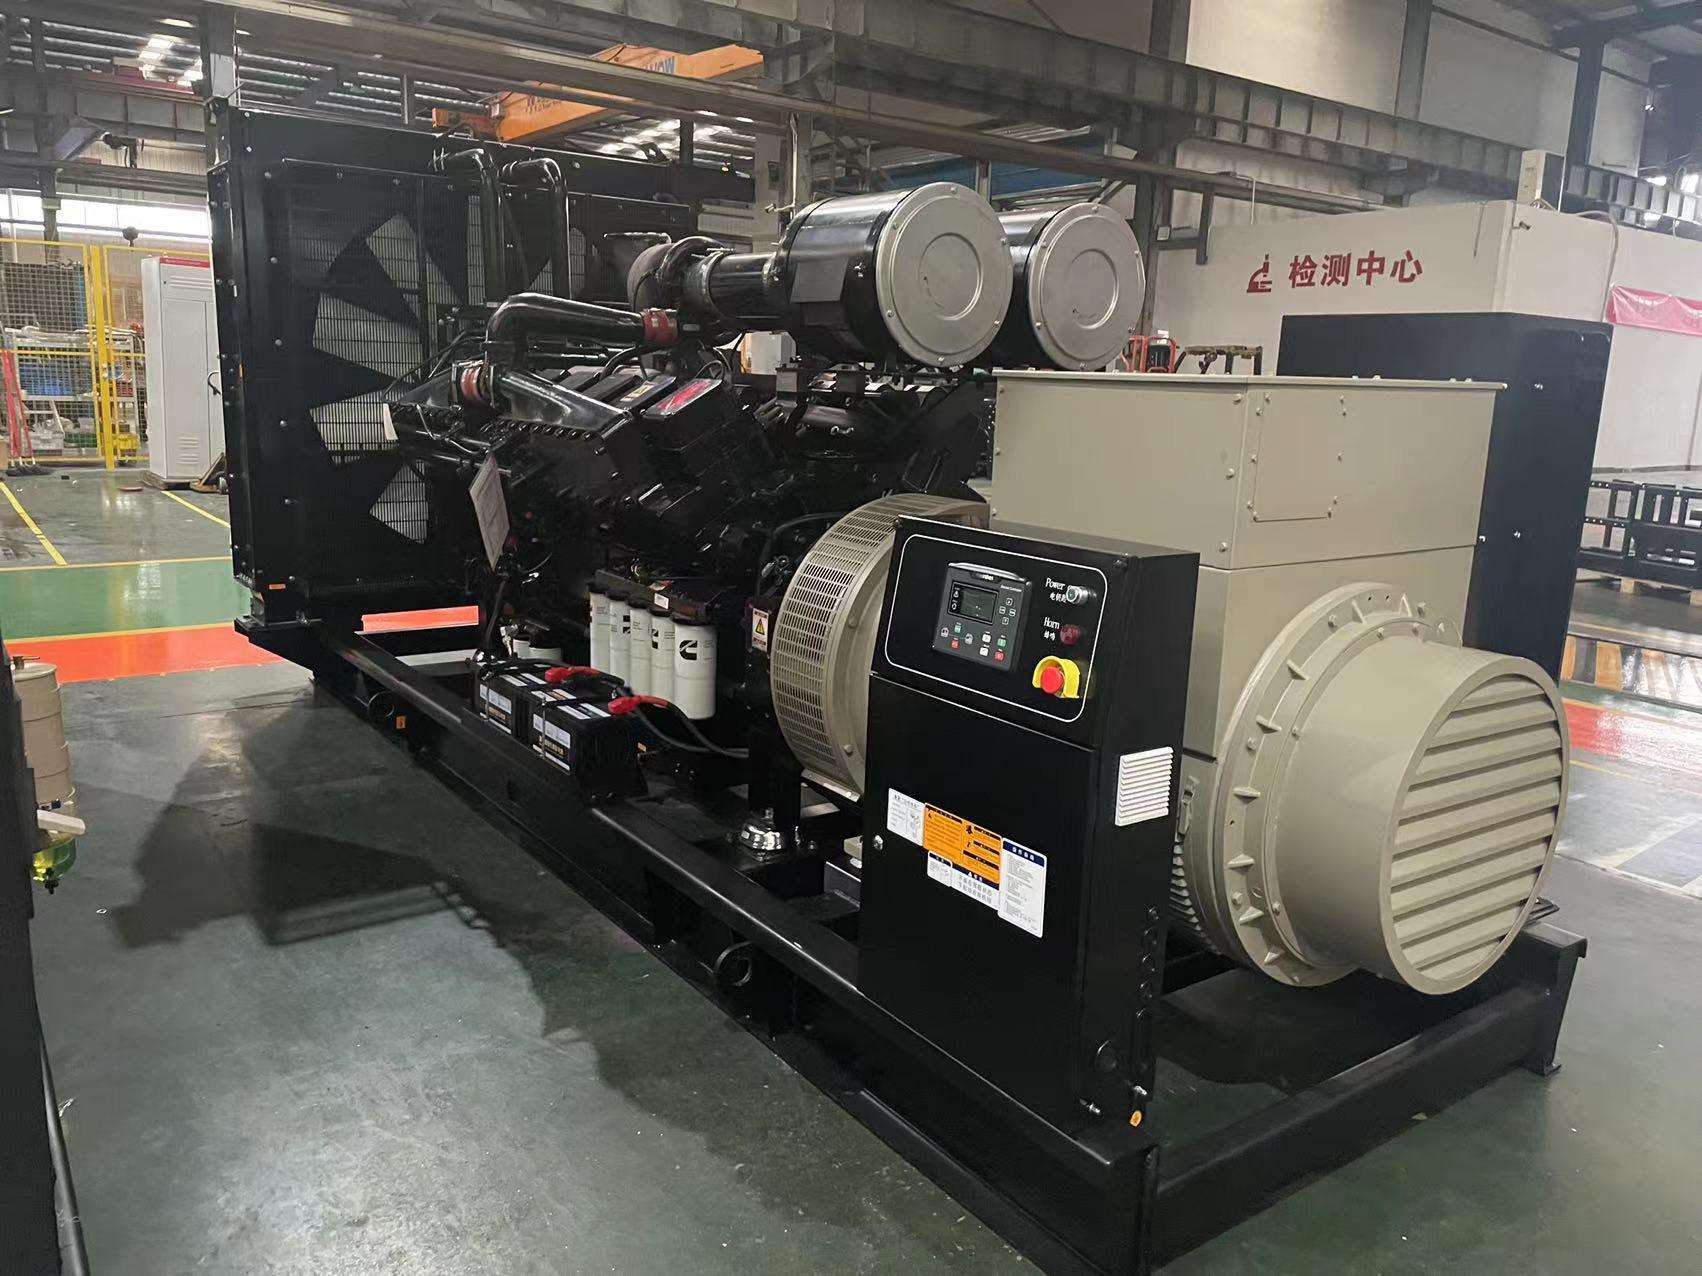
Tesla Power prints this order on the commissioning sheet of every export order, so the crew on site follows the same sequence the factory used at the load test. A level read cold, a core read with a torch and a cap tested against its rating clear or convict the whole circuit before a single enclosure panel comes off.
What do the radiator and thermostat tell you?
The radiator face convicts more sets than the water side does. Fins blocked by dust, oil mist or seed cut the core area quietly, and the loss shows first on a 45 degree afternoon rather than on a mild one. Wash the core from the engine side outwards at low pressure, and record the intake figure before and after. A core that recovers 5 degrees or more was the cause, and the wash then joins the service schedule.
The thermostat is the second cheap check. Hang it in a heated pot, note where it starts to open and where the stroke finishes, and compare both figures with the data sheet. A valve that starts opening at 82 degrees and finishes by 95 behaves as marked. One that stops halfway holds the engine hot at every load. Many genset manufacturers ship a spare thermostat in the spares box for that reason, and the swap takes half an hour on site. Our own 500kVA silent frames go through the same pot test at the works, and Tesla Power issues that record inside the commissioning file with every frame.
How does enclosure airflow raise the intake temperature?
Air is the second circuit, and the figure that matters is the temperature at the enclosure intake rather than the shade figure in the yard. A box in full sun runs its intake 5 to 8 degrees above the yard on a still day. Every degree above the rating basis takes capacity off the plate before the load lands. The controller cannot tell the two figures apart, so the trace has to measure both.
Louvre free area decides how much of that hot air the fan can replace. A common site fault is a louvre sized on the door area rather than on the fan curve, which starves the radiator and pushes the coolant line up on exactly the afternoons the set is needed. The symptom is specific. The rise appears on still days and fades when the wind moves across the intake.
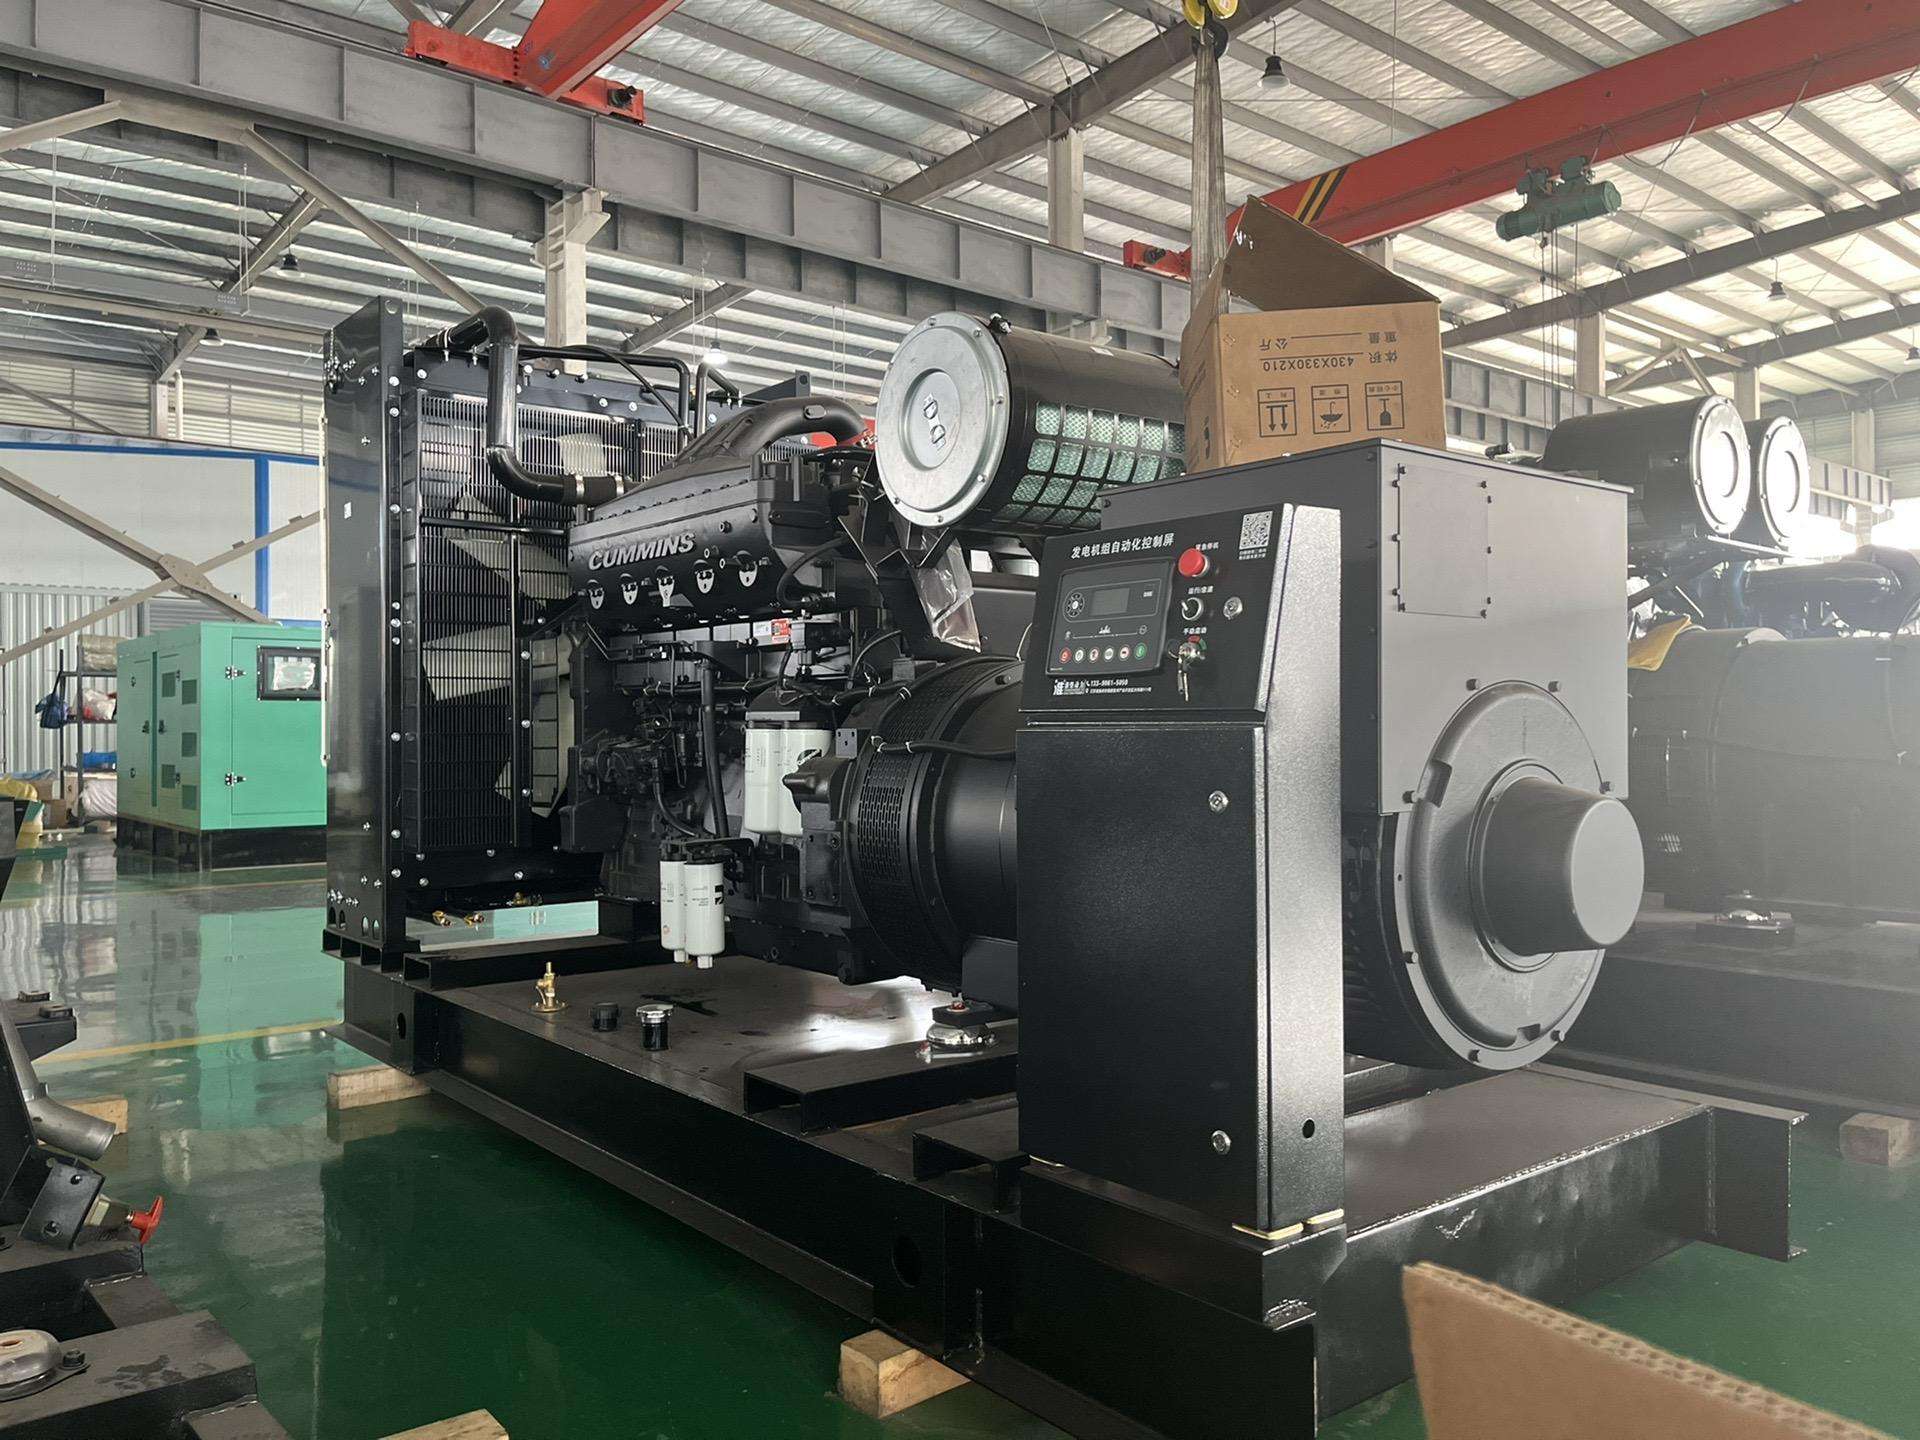
The louvre free-area method sets out the calculation against fan flow. It takes ten minutes with a tape and the airflow figure from the data sheet, and it settles the argument before parts are bought.
How far can load go above the rating in heat?
The load side is where heat and rating meet. A set is rated at a reference temperature, and the derating chart, not the plate, states what the intake air costs. The arithmetic is simple enough to do on a phone at the set, with the intake figure measured at the enclosure rather than read from a forecast, before any part is ordered.
500kVA × 0.8 power factor = 400kW at the reference figure, and roughly 3% of the figure goes for every 10 degrees Celsius the intake sits above the basis. 400kVA × 0.8 power factor = 320kW, and 250kVA × 0.8 power factor = 200kW on the same basis, so the proportion applies across the range. What the trace looks for is load held above the corrected figure for long stretches, because that is the fault a wash and a louvre cannot fix.
Suppliers state the reference rather than the correction. The duty classes defined in ISO 8528-1 define the reference basis both offers have to name, and the 400kW Weichai WP13 frame carries its derating chart beside the plate on the offer sheet. Tesla Power Equipment prints the intake basis on that chart, so a site figure can be compared with the works figure directly. For a genset overheating in hot climates, the intake figure is the first number to correct.
When does the rise appear, and what does the timing mean?
Timing separates the causes more cleanly than any single figure. A rise that appears in the first ten minutes of a run points at the air side, because a box reaches its worst intake temperature before the load does. A rise that appears an hour into a steady run points at a fouled core, which loses ground slowly as the fin area warms. Note the clock figure beside the temperature, because the shape carries the diagnosis.
A rise that follows each load step points at the load side, and a rise that appears only on the hottest afternoons points at the yard rather than at the set. The controller history gives all three patterns on one screen. Chinese genset suppliers who ask for that history before proposing parts are the ones a buyer can compare on evidence rather than on price.
When should the set be stopped?
Stop the set at the pre-alarm rather than at the shutdown, unless the load is life safety and the alternative is darker than the risk. A pre-alarm crossed while the log still records gives the trace its best data, because the set is hot and the cause is active. Note the time before anything is opened. Tesla Power prints the stop figure on the controller quick card for that reason.
Do not restart a set that has shutdown on temperature until the circuit is cleared. A second run on a fouled core or a dead thermostat turns a service stop into a head or bearing job. The NFPA 110 monthly test routine for standby systems assumes the set starts healthy, which is another reason to clear the fault between tests rather than through them.
What should you record for the supplier?
The record that gets a specific reply fits on one page. Timestamps, the load figure at each step, the coolant temperature beside it, the intake temperature at the enclosure, the yard shade figure, and a photo of the radiator face taken after the wash. Add the controller export from the alarm list, because the pre-alarm entries carry the times the summary view drops. One page travels better than a thread of messages, and it survives a change of crew at the site.
Send that page with the quotation request and the reply changes character. Yangzhou Tesla Power answers a trace record through the engineering desk that reads trace records, with the factory test log for the same frame set beside it. A supplier who receives a page can compare figures. A supplier who receives a complaint can only apologise.
Which documents make the supplier reply specific?
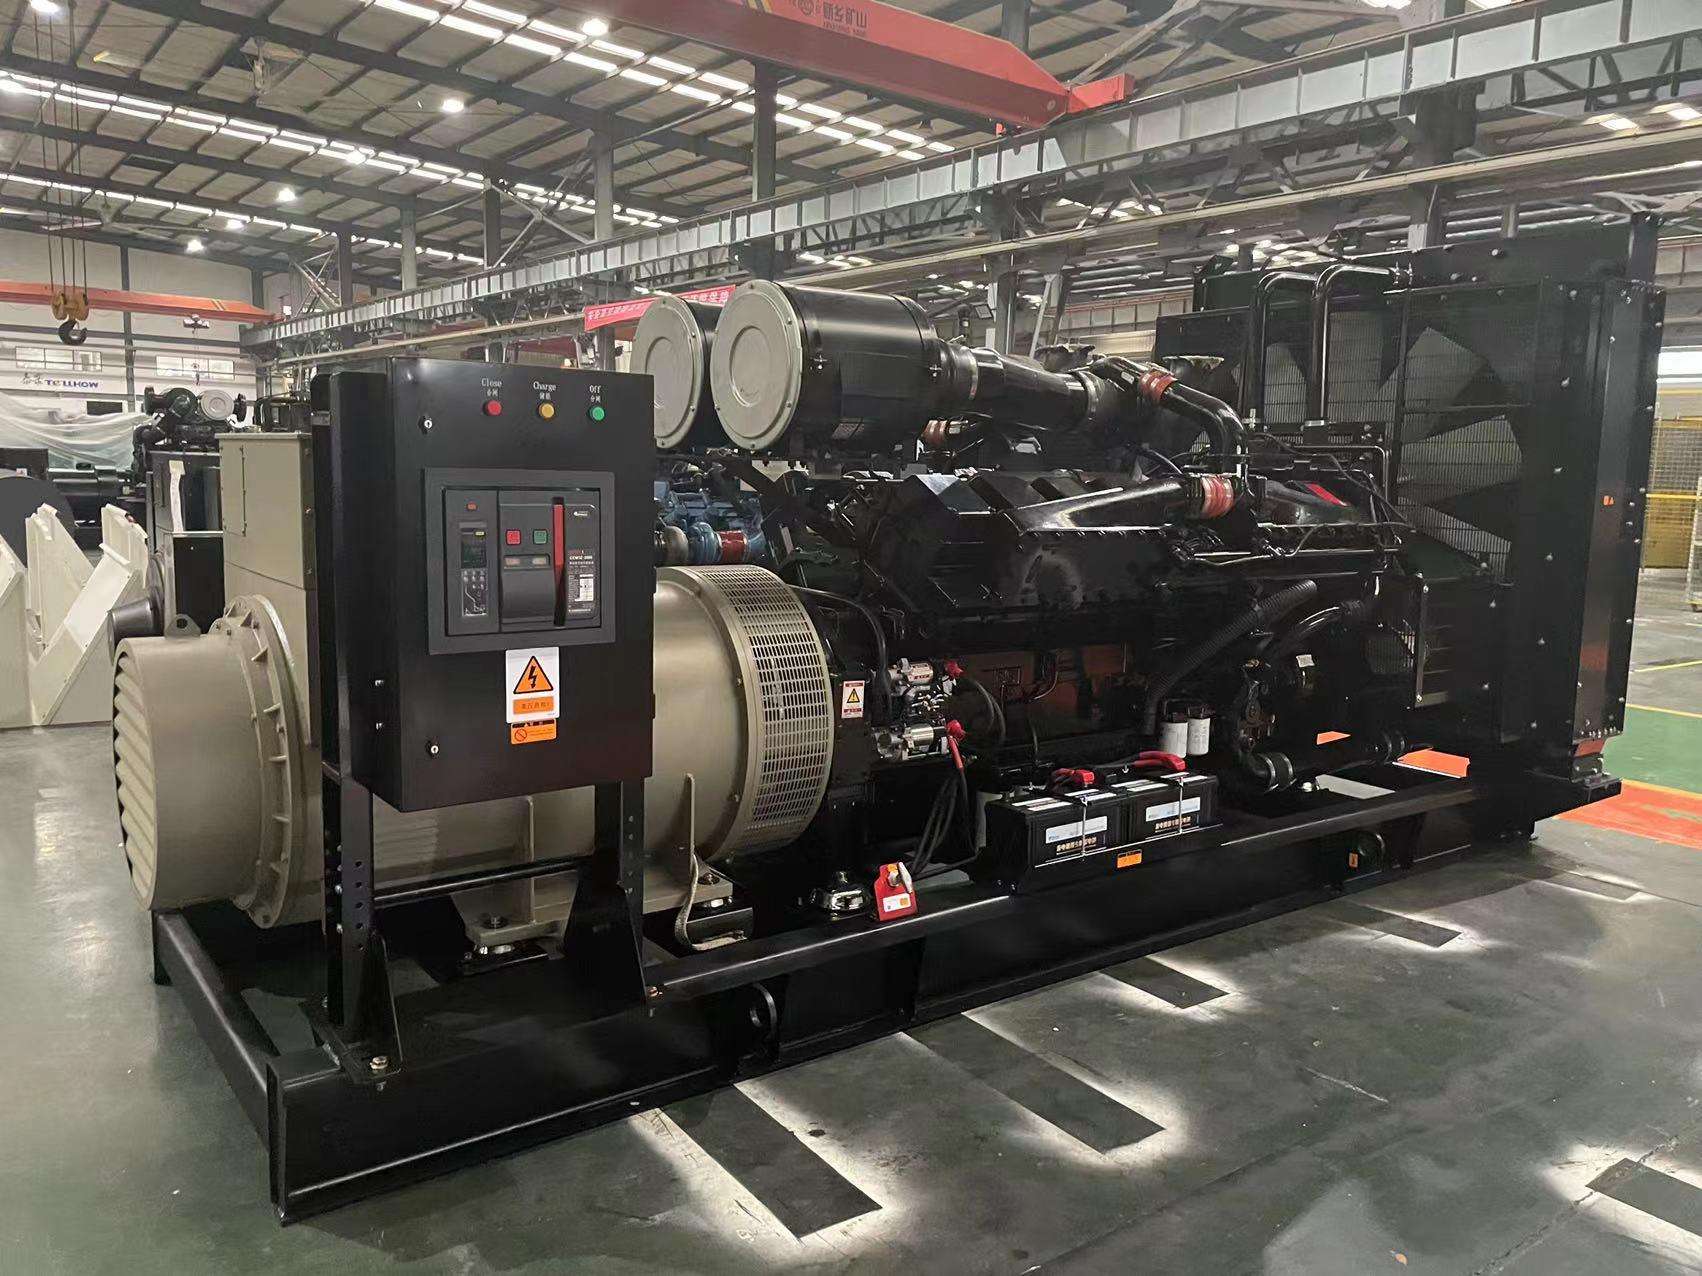
Conformity assessment for the genset runs on documents, and an overheating trace is no different. The commissioning log shows the coolant and intake figures the set carried at handover. The data sheet shows the thermostat figures and the fan flow. The derating chart shows the correction the site should have applied.
Ask for those three documents with the quotation, and read the trace against them in that order, with the derating chart as the line the correction is read from. Genset documentation for the export file belongs with the set, not in a drawer at the factory.
Tesla Power keeps those records on file for every frame shipped, and a buyer who asks for them five years later gets the same pages the inspector saw at the port. A genset overheating problem for export buyers is closed with that file, one page at a time.
Frequently asked questions about the genset overheating problem
Read the controller rather than the gauge on the radiator. Most export sets pre-alarm near 95 to 98 degrees Celsius and shut down near 98 to 102. A set that runs a few degrees under the pre-alarm on a hot afternoon is inside its design, and the trace only starts when the line crosses it.
Heat alone rarely trips a healthy set that carries a derated load. What heat does is shrink the margin, so a core that was half blocked in spring becomes a shutdown in summer. The trace separates the two by reading the intake figure and the load figure together.
Sometimes, and often not. A core upgrade fixes a fouled or undersized radiator, and does nothing for a short louvre, a warm intake or a load held above the corrected figure. The trace costs one page of records. The wrong radiator costs a shipment. The derating chart behind a hot-yard rating shows the margin heat took before any part was changed.
Long runs expose the slow faults. A thermostat that stops halfway holds the engine near the alarm line after an hour, and a core that loses ground slowly crosses it on the second hour. Short test runs end before either fault appears, which is why the record from a long run matters.
The controller export with the coolant line, the load line and the clock together. It shows the shape of the rise, the timing inside the run and the load held at the same moment. One file answers the three questions a supplier would otherwise ask across a week of messages.
On load, because an idle run hides the load side and warms the core too little. Hold a fixed load near 70% of the corrected rating, log the figures every five minutes, and change one condition at a time. An idle check is useful only for the thermostat stroke.
In dust and seed season, wash monthly and record the intake figure before and after each wash. Where the drop between washes exceeds 3 degrees, shorten the interval or fit pre-screens. Tesla Power sets the wash interval in the service schedule against the site dust report, not against a calendar default.