
Generator fuel use or existing unit is the question Tesla Power hears most before a replacement order is signed, because the answer sets the diesel bill for the next ten years, not the sticker on the frame. The honest way to compare the two machines is to put them on the same load profile, the same altitude and the same fuel, then read the litres per hour at each step from no load to rated. A bare claim of "more efficient" hides the curve, and the curve is where the money lives. We measure fuel use against the duty the set actually runs, not the brochure peak, because a 500kVA unit at 0.8 power factor = 400kW that idles at 30% burns a different sum than one trimmed to the same site. Decide the comparison from the site's true load, then ask a supplier for the export rating and a quotation against that profile, so the running cost is priced instead of the rated guess.
- Put both sets on the same load profile and read the litres per hour from the nameplate of the product line the factory builds, not from a headline figure.
- Hold altitude and fuel grade constant, because a 500kVA unit at 0.8 power factor = 400kW at 1,500m burns more than the same set at sea level, and the gap is not small.
- Ask for the curve, not the peak, and request a quotation that names the litres per hour at 25%, 50%, 75% and 100% load.
- Keep the comparison on one duty basis so the export rating you receive is read against your own site, not a showroom floor.
What does generator fuel use measure?
Fuel use is the litres per hour a set draws from the tank while it holds a given load, and that figure moves with the load, the altitude and the fuel itself. A set sized to 500kVA (= 400kW at 0.8 pf) that runs most of its life at 40% load tells a different story from one pinned at 90%, even though both carry the same nameplate. The number that matters to a buyer is the area under the curve across a month, not the single point at rated. Comparisons of a new unit with the existing one fail when the two machines are read at different points, because the brochure usually quotes the friendly one. Tesla Power Equipment records the duty the set is built for, so the comparison starts from a known base rather than a guess.
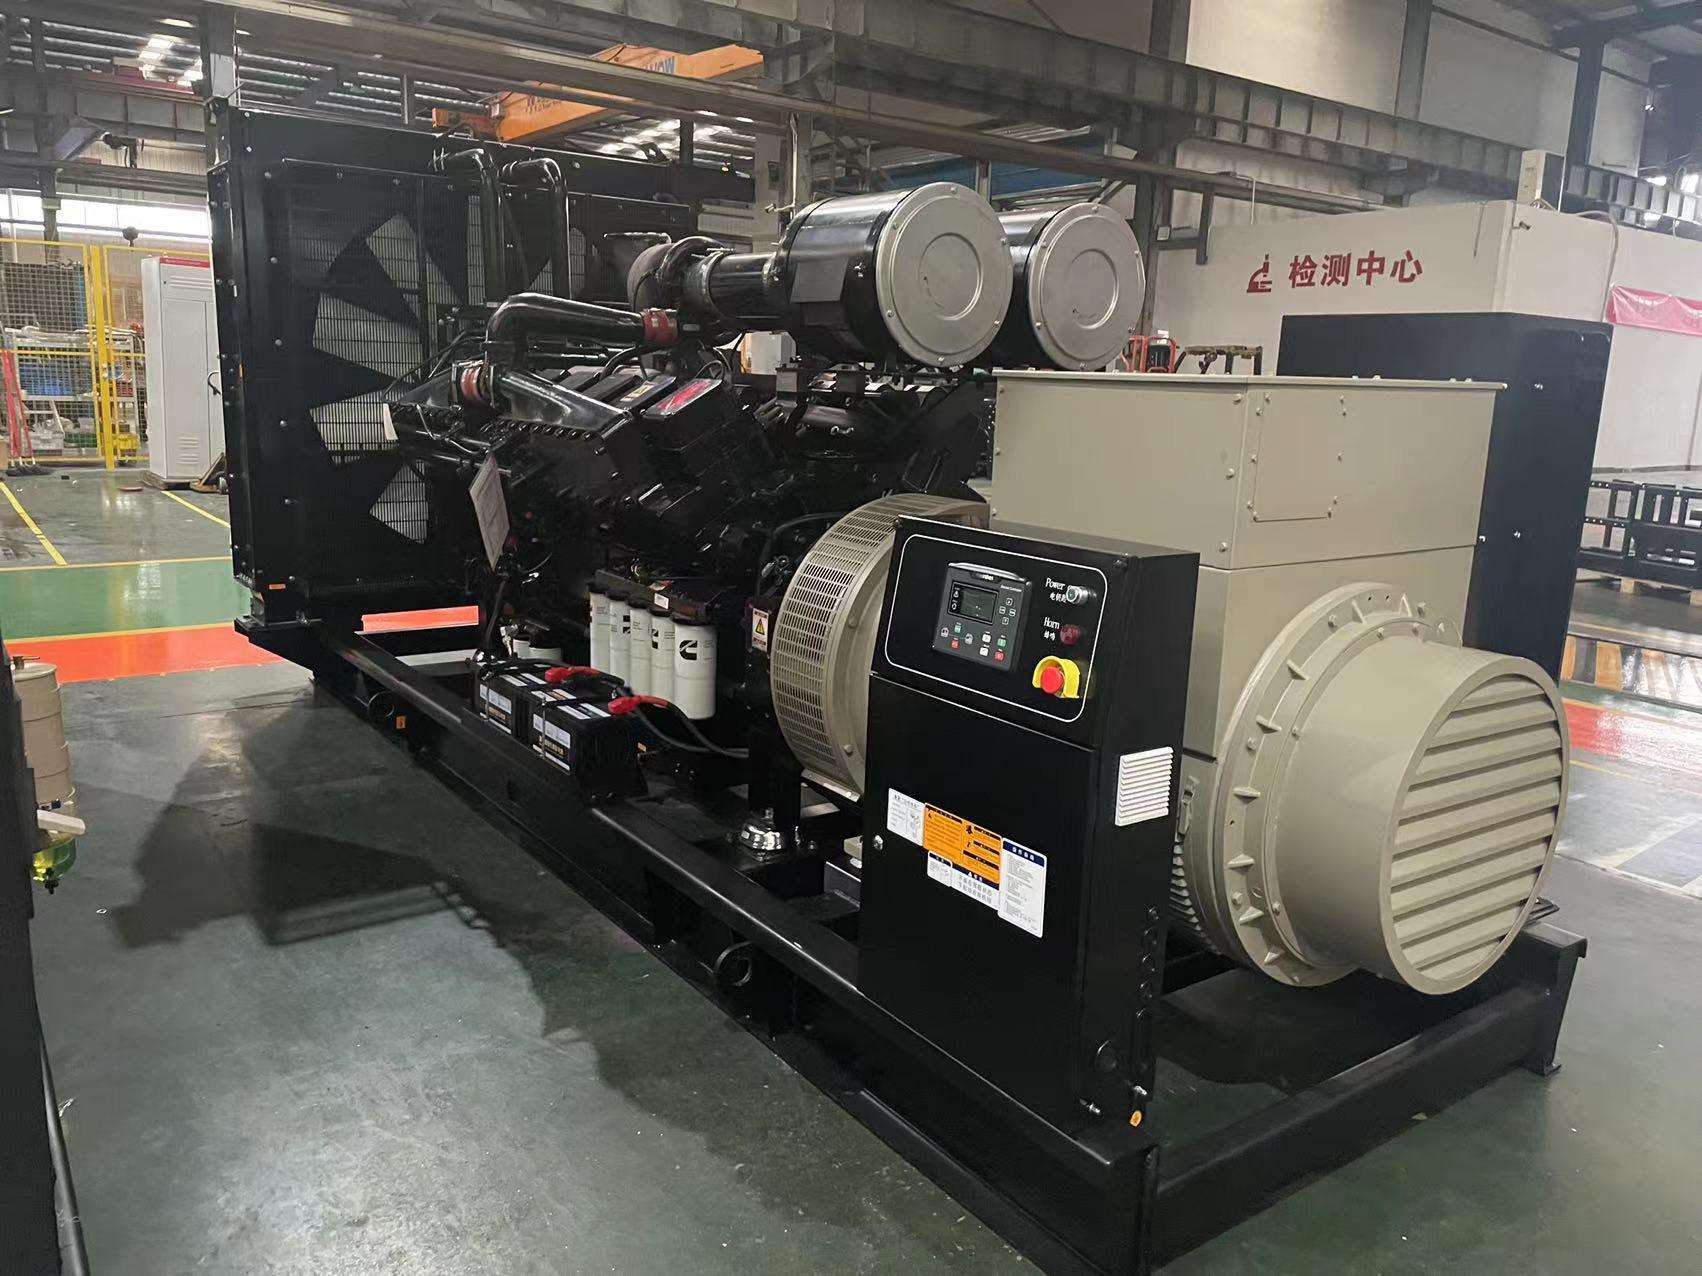
The fair unit is litres per hour at a load point, stated with the kilowatt figure it was measured at. Some quotes swap to litres per kilowatt hour to flatter a smaller set, and that switch hides the idle burn that dominates a standby duty. Insist on litres per hour at named load points, because the hourly figure is what the tank and the delivery schedule feel. A 250kVA frame (= 200kW at 0.8 pf) and a 500kVA frame (= 400kW at 0.8 pf) should be compared at the same load point, not at their different peaks.
How does your unit compare with the existing one?
The fair comparison starts by logging the existing set for a week, then asking the new frame to match those exact load points on a flow meter. Most sites discover their old machine idles low and spikes high, and a replacement tuned to that profile saves fuel at the points that actually occur. Tesla Power reads the logged profile beside the fuel map built for the order, so the "new versus existing" answer is a curve match, not a slogan. Where the buyer cannot log the old set, we model the duty from the connected load list and state the assumption openly.
| Load point | New 500kVA set (400kW at 0.8 pf) | Existing set | Difference per hour |
|---|---|---|---|
| 25% load | 31 L/h | 38 L/h | −7 L/h |
| 50% load (200kW) | 54 L/h | 63 L/h | −9 L/h |
| 75% load | 79 L/h | 91 L/h | −12 L/h |
| 100% load (400kW) | 106 L/h | 121 L/h | −15 L/h |
The rows above are typical figures read on a calibrated meter for illustration; the real comparison uses your logged profile and the new frame's map. Note the saving grows with load, because the older engine loses its edge exactly where the site hurts most. A buyer who only checks the peak number misses the part-load sum that fills the tank. The works ships the map with the set so the two curves can sit on one sheet and the quotation answers the profile, not the peak.
Hold both sets on prime or both on standby, and do not mix them, because a standby rating hides the continuous burn a prime duty shows. The prime standby guide explains why the duty name changes the fuel you can trust. Read the difference from the fuel grade too, since a summer diesel and an arctic diesel carry different energy per litre, and that alone shifts the comparison by a few percent.
Why does load profile change the litres per hour?
Diesel engines drink least near 70% to 80% of rated, and most at the low idle where standby sets live. A replacement that trims the part-load burn saves more than a small gain at full output ever could. The load profile decides the number: it sets where on the curve the set lives, and two sets with the same tank can post very different monthly sums. A flat "X% better" claim means little until the profile is named. Tesla Power models the connected load before a quotation, so the curve matches the site, not a showroom.
At 30% load a 400kW engine may burn close to half its full-load fuel, because the parasitic loads and the cooling fan do not shrink with the load. A site that runs eight hours a day at 35% sees the tank fall on the idle number. Hot climate makes this worse, because the radiator fan runs longer and the intake air is thinner, nudging the hourly burn upward.
What proves the fuel figure is fair?
A figure is fair when it comes from a staged load run on a calibrated meter, with the ambient, the fuel grade and the load step written down. A set that only shows a catalogue number has not proved anything, because the catalogue point is chosen to look good. Tesla Power runs each frame on the test bay and records the litres per hour at four steps, so a buyer compares measured curves, not printed hopes. The works quotation desk sends that sheet with the offer, and the buyer reads the new set against the old one on equal terms.
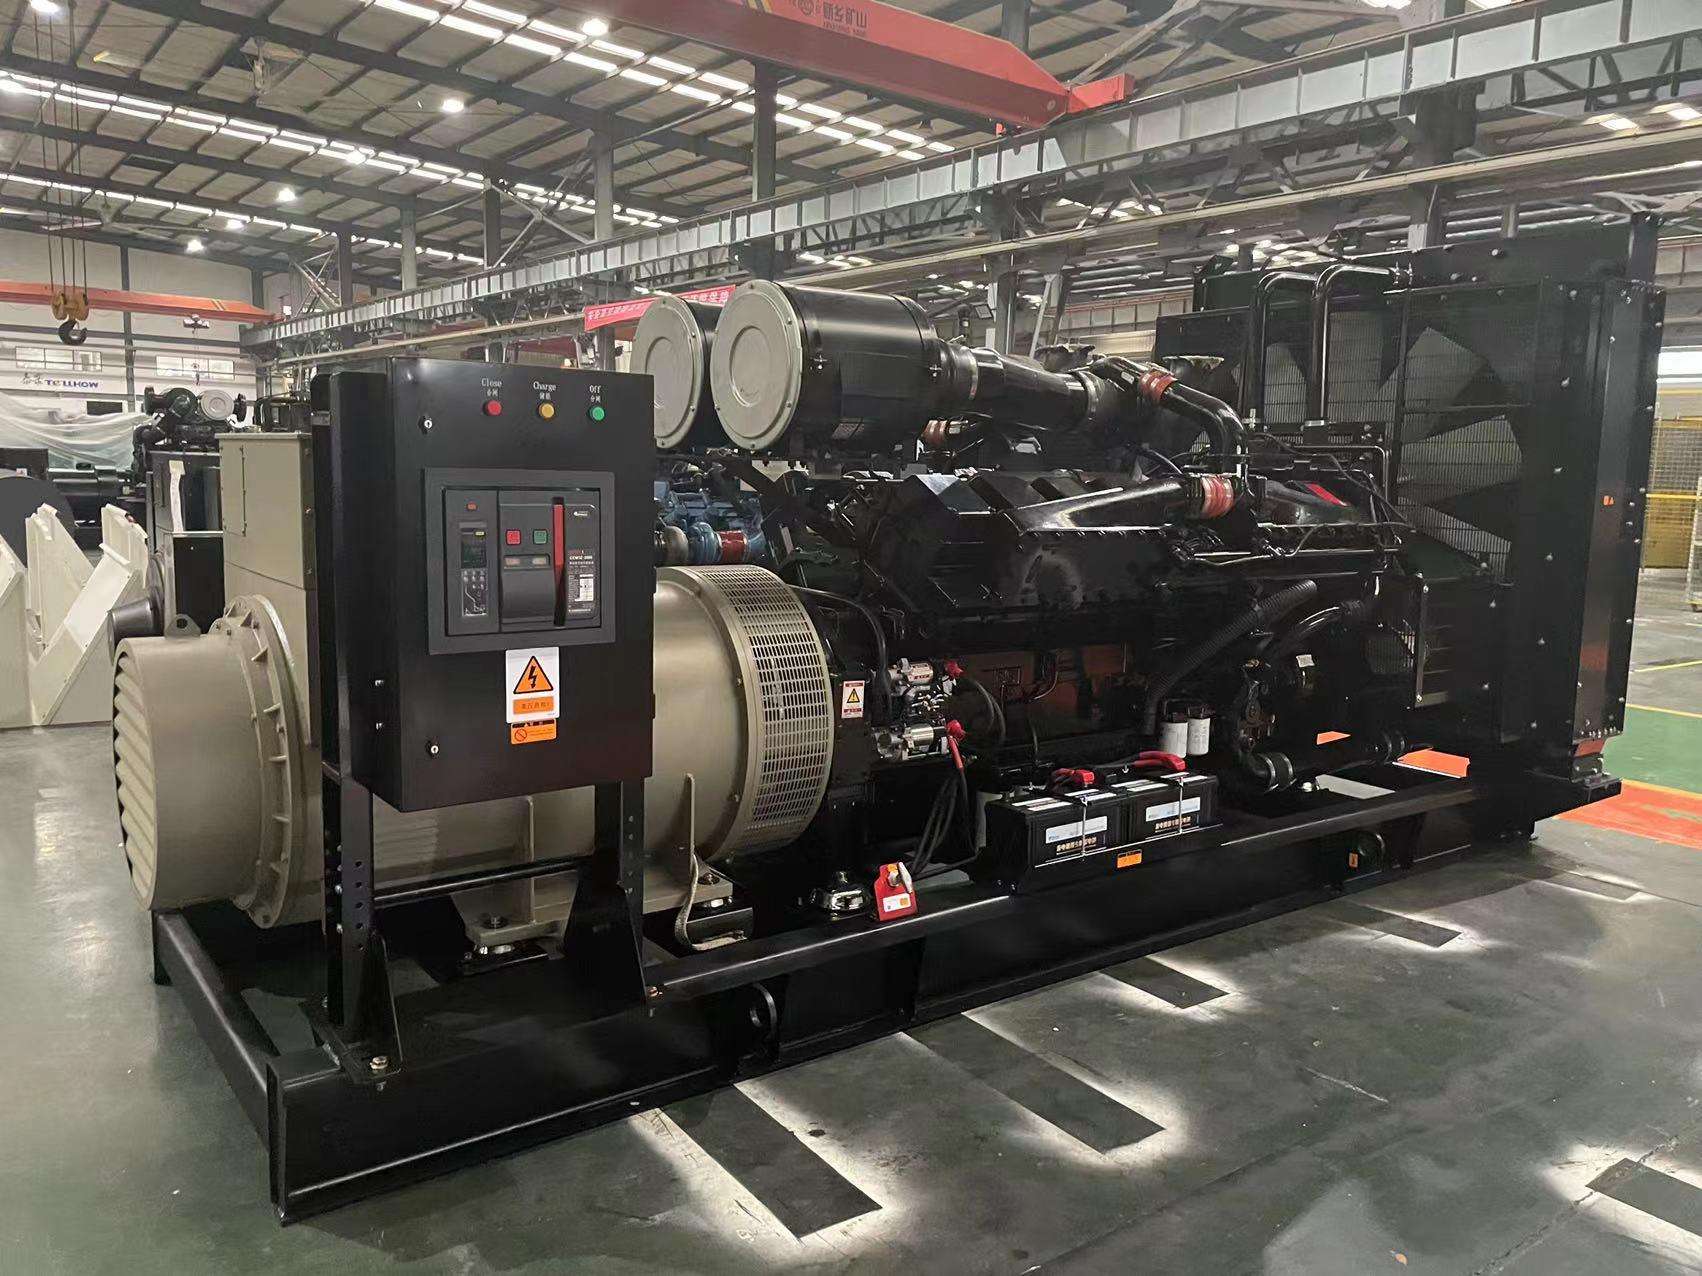
The acceptance method matters as much as the meter. the ISO 8528-1 acceptance basis sets the performance and acceptance basis for reciprocating engine generator sets, and it is the reference most export buyers accept for a like-for-like read. IEC covers the rotating machine side of the same set, so the alternator efficiency that returns into the fuel sum is also on a known basis. Two curves taken to different standards cannot be compared, and that mismatch is the usual source of a "why does my new set burn more" complaint.
A load bank lets the buyer dial the exact load point the comparison needs, instead of waiting for the site to wander there. On the bank, 25%, 50%, 75% and 100% are set, held and read, which removes the guesswork a live site introduces. The reading then travels with the set as part of its file, and the next owner reads the same curve the first one saw before.
Generator fuel use against generator fuel efficiency
The two terms get used as if they were one, but they answer different questions. Fuel use asks how many litres the tank loses in an hour; efficiency asks how much of the fuel's energy reaches the terminals. A set can post a strong efficiency at full load and still post a poor hourly burn at the part loads where your site lives, which is why the use-versus-efficiency split belongs in the same sentence. Buy the curve your profile walks, and treat the peak efficiency as a footnote rather than the headline.
For a buyer weighing the 400kW auto start set against an older frame, the useful read is the litres per hour at the duty points, not the brochure brake-specific figure. The auto start logic also trims the warm-up burn, because the set reaches load faster and idles less between calls, and that saving sits in the monthly sum where the tank feels it. Tesla Power tunes the start map to the duty, so the saving shows on the meter, not only on the data sheet.
Efficiency is a ratio and stays flattering across the curve; fuel use is an absolute and grows with every parasitic load. A worn fan clutch or a tired injector dents fuel use long before efficiency looks bad on paper. Chinese generator fuel use suppliers who quote only the ratio leave the buyer comparing the wrong line, so ask for the hourly figure at your points and read the two together on the same sheet.
Generator fuel use on the mining site
Mining duty is the hard case: the set runs long hours at a heavy, uneven load far from a depot. A 500kVA frame (= 400kW at 0.8 pf) on a pit may burn more in a week than a standby set burns in a year: the hourly figure drives the logistics, not the capital cost. The mining site guide walks the duty profile. Tesla Power sizes the pit frame to the swing.
At a remote pit the comparison that counts is litres per day delivered by truck, because a dry tank stops the shovel regardless of the kW nameplate. The fuel curve on that site therefore favours a set whose part-load burn is low, since the load swings and the set idles between digs. A frame tuned to hold 400kW cleanly across the swing saves the convoy runs, and those runs cost more than the diesel in them.
How is fuel use recorded for the buyer?
A credible comparison leaves a paper trail: the load log of the old set, the four-step reading of the new set, the ambient and the fuel grade, all on one sheet. The buyer keeps the evidence the next quotation is measured against, because without that file the number is a memory, and memories drift toward the figure the seller wanted. Tesla Power Equipment files the map and the test run with every frame, so the curve the first owner saw is the curve the next one reads.
| Site altitude | Output held | Litres per hour | vs sea level |
|---|---|---|---|
| Sea level (0 m) | 400kW | 106 L/h | baseline |
| 1,500 m | 400kW | 118 L/h | +12 L/h |
| 2,500 m | 400kW | 129 L/h | +23 L/h |
The table shows why altitude belongs in the comparison: at height the engine works harder to hold the same 400kW, so the hourly burn rises even when the load does not. A mining or mountain site that compares a sea-level figure with its own reading will feel shortchanged unless the altitude is stated up front. The works notes the site altitude on the fuel map so the buyer reads the right line, and the derate is stated before the order rather than discovered after.
The file should name the test method, the four load points, the fuel grade and the ambient, because those four lines let a later quotation be read on the same basis. The generator fuel use documentation for export should also name the standard the reading was taken to, so customs and the buyer's engineer see a method, not a marketing point. Generator fuel use manufacturers who skip the file leave the buyer comparing memories; ask for the sheet and keep it with the order so the next comparison starts from evidence.
Which standards back the fuel claim?
Three references keep a fuel claim honest. ISO 8528-1 fixes the acceptance test the litres per hour are read on. IEC covers the alternator efficiency that returns into the tank. The engine emission tier, such as EPA Nonroad Diesel Tier 4, sets the combustion limits that the fuel map is tuned within, so the same frame bound for different markets carries a different map. Yangzhou Tesla Power Equipment Co., Ltd. matches the map to the destination tier, and that choice shows up as a small shift in the hourly figure rather than a promise about it.
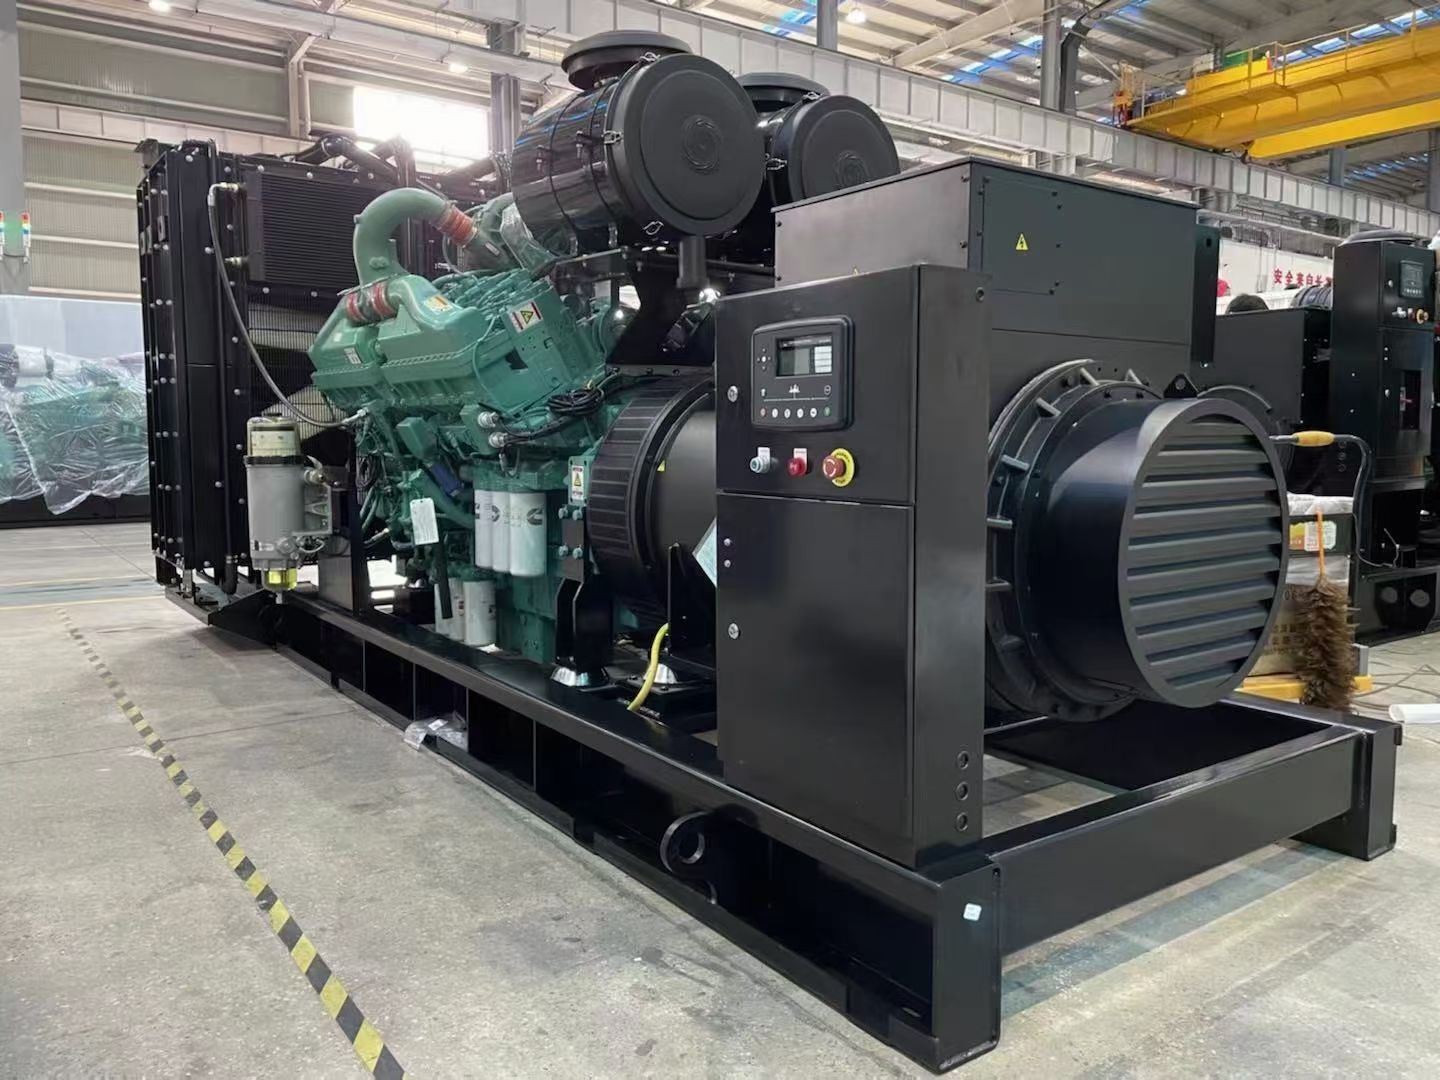
The buyer should read the claim against the destination, because a set tuned to one tier is not a like-for-like match with a set tuned to another. The generator fuel use ce marking requirements ask for the marking on the frame and the file behind it, so the comparison rests on a documented method rather than a verbal assurance. send the site load list that names the tier, the standard and the four load points, and the running cost becomes a number you can bank, not a hope you inherited.
Last updated 2026-11-10: the curves quoted here reflect the engine maps shipped on current frames, and the method above is the one the works applies before a quotation leaves the desk.
Generator fuel use or existing: the buyer's questions
Log the old set for a week at its real load points, then read the new frame on a calibrated meter at the same points and the same fuel grade. Hold both on the same duty basis, prime or standby, and write the ambient down. The comparison is a curve match, not a single peak number, and the four-step reading removes the guesswork a catalogue introduces.
Most surprises come from reading the brochure peak against your part-load life. A set sized to 500kVA (= 400kW at 0.8 pf) that idles at 30% lives on the flat part of the curve, where the hourly burn stays high. Compare the litres per hour at your duty points, not the rated figure, and the new set usually proves itself where your tank actually feels it.
Yes. At 1,500m a 400kW set may burn roughly 12 L/h more than at sea level to hold the same output, and at 2,500m the gap grows past 20 L/h. The engine works harder in thin air, so the hourly figure rises even when the load does not. State the site altitude on the fuel map so the comparison uses the right line.
For a buyer, litres per hour at named load points is the clearer figure, because it is what the tank and the delivery truck feel. Litres per kilowatt hour can flatter a smaller set and hide the idle burn that dominates standby duty. Ask for both, but read the hourly curve first.
A useful quotation names 25%, 50%, 75% and 100% load, each with the litres per hour and the kilowatt it was measured at. That four-step sheet lets you set the new curve against the old one on equal terms, and it travels with the set as part of its file for the whole service life.
The reading should follow ISO 8528-1 for the acceptance test, with IEC covering the alternator side, and the engine tier (such as EPA Nonroad Tier 4) naming the combustion limits the map was tuned within. Two curves taken to different standards cannot be compared, so confirm the method before you weigh the numbers.
It can. A staged load-bank run dials the exact points the comparison needs and holds them long enough to read, which removes the drift a live site introduces. For a large order a witnessed run settles the argument before the frame ships, and the reading becomes the baseline the new set is judged against for its whole service life.
The catalogue picks the friendly point, and the friendly point is rarely your duty point. Ask a supplier for the export rating and a quotation built on your logged profile, so the running cost is priced against your site rather than a showroom. The fuel map and the test sheet then sit on the same page as the price, and Tesla Power includes both with the offer so the next comparison starts from evidence.