
This guide explains how a diesel generator fuel consumption chart lists litres per hour and per kWh at each load step, so buyers predict running cost before choosing a set. Tesla Power's team reads the same curves on export units, then compares diesel generator manufacturers before requesting a quote.
- Read litres per kWh. The per-kWh figure compares two sets fairly, while the per-hour figure sizes the tank.
- Match the load factor. Read the curve at the load the site actually carries, not at the nameplate maximum.
- Ask for the as-tested curve. A brochure average hides the part-load penalty that breaks most budgets.
- Size the tank from the worst case. Daily burn at peak load sets the volume, then add the refill interval.
The chart is a procurement tool before it is a spec sheet. This reference works through the two axes, the load factor, the rating class and the ambient corrections, then shows how a China diesel supplier should present the data so a buyer can price a project. See the generator load factor explained for the duty profile that feeds the numbers below.
How a Diesel Generator Fuel Consumption Chart Guides Procurement
The chart turns a vague fuel question into a number you can defend in a budget. A buyer reads the curve at the load the site actually carries, not the nameplate maximum. That single step removes most of the cost surprises on a multi-year contract. The same chart also exposes whether a quoted figure came from a real test or a rounded marketing number. Most budgets break at the left edge of the curve, not the right.
Procurement teams that skip the chart usually discover the gap at the first fuel invoice. We treat the curve as the baseline for any running-cost estimate, and the difference between 75% and 50% load on a 500kVA set is larger than many buyers expect. The duty profile decides which number matters. Tesla Power builds the estimate from this chart before anything else.
What the Two Axes Actually Measure
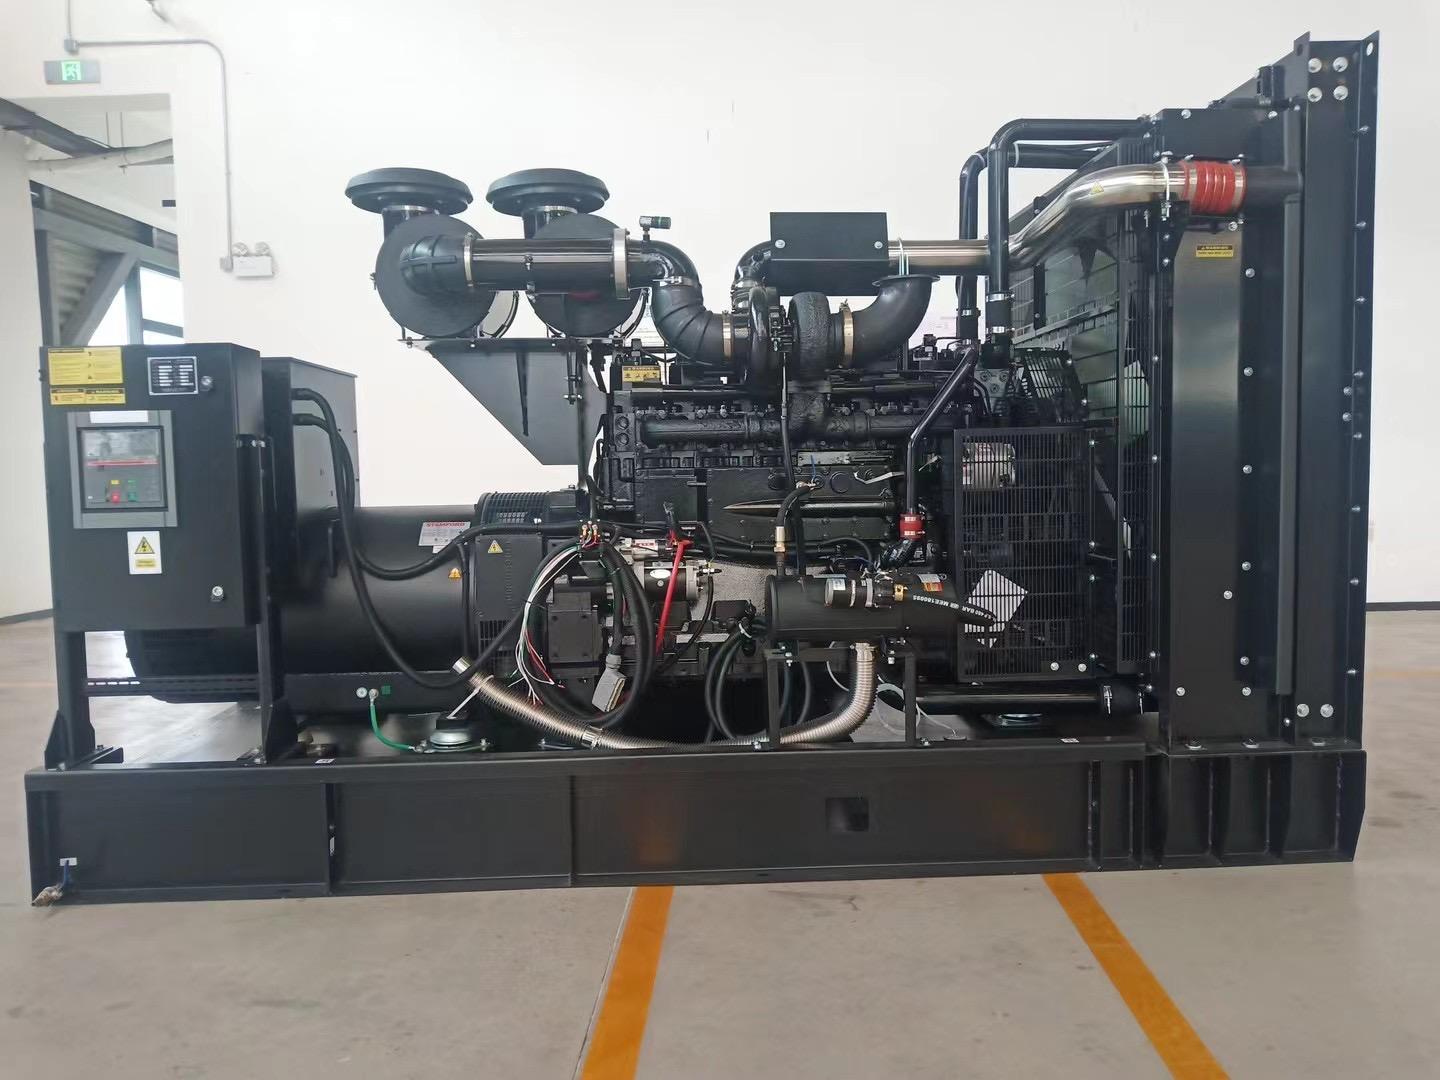
The horizontal axis is load. It is shown as a percentage of the rated output or as the kilowatt value at that step. The vertical axis is the burn, and here the chart splits into two measures that buyers confuse constantly. One is litres per hour, the rate at the moment. The other is litres per kWh, the efficiency over the energy produced.
Litres per hour sets the tank. It is the drain rate during a run, and it drives tank size and refill frequency. Litres per kWh sets the budget. It is the cost per unit of energy, and it compares two sets fairly. A high-hour, low-efficiency set can look fine on the hourly axis and poor on the per-kWh axis, which is why the second number is the one to watch.
When you compare two offers, force both suppliers onto litres per kWh at the same load point. A 50kVA set and a 200kVA set compare cleanly this way, because the efficiency figure removes the size difference. The per-kWh band is the honest answer, whichever way you read the axes.
Why Load Factor Changes the Number
Load factor is the average load divided by the rated load over a period. It moves the operating point along the curve. A set running a steady 75% load sits on the flat, efficient part of the curve. A set that idles at 20% then spikes to 90% averages poorly and burns more per kWh than either point alone. Tesla Power sees this gap most often on oversized standby sets that idle below 30% of rating.
The brochure number is a trap. Many brochures quote their best figure at 75% or 80% load. That is the sweet spot for a diesel engine. A buyer who assumes the figure holds at 30% load will under-budget fuel by a wide margin. The per-kWh burn climbs as the load drops, and the engine overhead spreads over fewer kilowatt-hours.
The arithmetic, once. A 500kVA set at 0.8 power factor delivers 400kW. At 80% load the electrical output is 400 × 0.80 = 320kW. With a typical specific consumption of 0.26 L/kWh, the hourly burn is 320 × 0.26 ≈ 83 L/h. Over a 24 h run that is 83 × 24 ≈ 2,000 L. That is the number you hand to the fuel buyer.
Part load is the penalty zone. From 50% to 100% load the litres per kWh stay close to 0.26. Below 30% they rise sharply, because the engine carries its own overhead on a small useful load. A set sized too large for its real duty spends more time in that zone, so oversizing quietly raises the fuel bill. A 1000kVA set at 0.8 pf gives 800kW; at 75% load that is 600kW, or 600 × 0.26 = 156 L/h.
| Load point | Specific consumption (L/kWh) | Approx. burn at 500kVA / 400kW (L/h) |
|---|---|---|
| 25% load | 0.30–0.34 | 30–34 |
| 50% load | 0.26–0.29 | 52–58 |
| 75% load | 0.25–0.27 | 75–82 |
| 100% load | 0.26–0.29 | 100–116 |
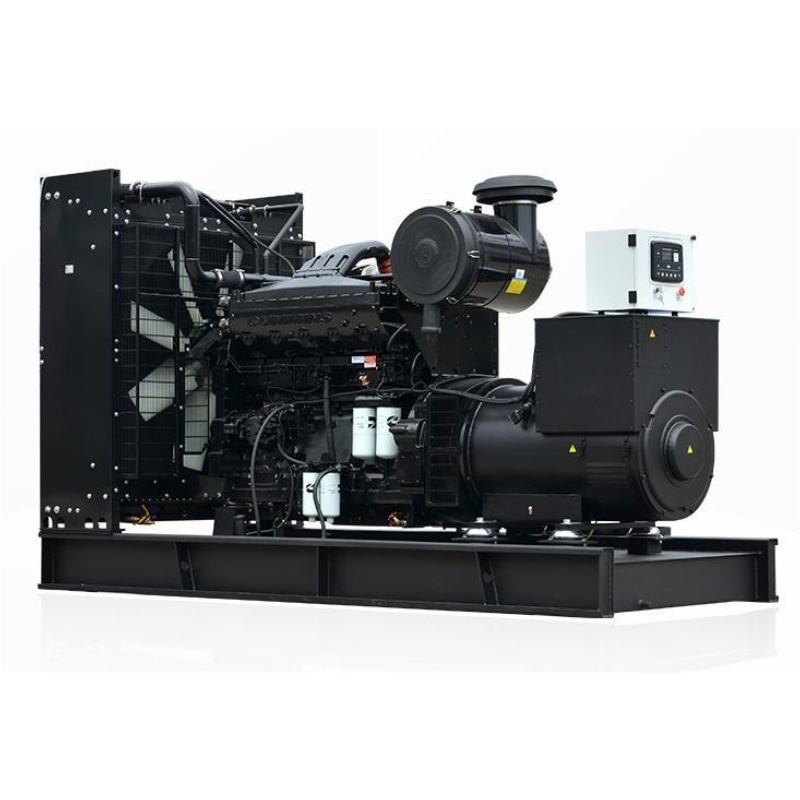
The table above is a representative band, not a single tested value. The exact figures live on the manufacturer's fuel curve for that engine and alternator combination. Read the curve at your real load points rather than trusting the midpoint, because the left edge of the chart is where budgets quietly drift.
How Rating Class Shifts the Curve
The rating class defines how hard the set may run. Tesla Power Equipment states the class up front on every quotation, because it changes which part of the curve the supplier may print. The ISO 8528-1 rating definitions split prime, standby and limited-run duties, and each has a different permitted running hour and load ceiling. A standby-rated set quoted at prime numbers overstates economy and understates wear.
Prime power assumes variable load up to the rating for unlimited hours with a 10% overload allowance. Standby assumes a fixed load for a limited number of hours per year. The hardware is the same, but the number you may print changes with the class. Ask which class the quoted litres per kWh belongs to before you compare two offers. A diesel for prime duty and a diesel for standby duty share the curve, not the permission. Our 500kVA silent diesel generator set ships with the curve stamped to its rated class.
What Does Prime Power Cost to Run?
Prime power is the expensive duty, because the set runs for many hours and the fuel bill compounds. Tesla Power sizes prime sets to the real duty rather than the nameplate, so the per-kWh figure the buyer plans with stays honest. A prime-rated 500kVA set at a 70% average load burns in the region of 75 L/h, or close to 1,800 L per 24 h. That scale is why the per-kWh figure, not the per-hour figure, governs the buying decision.
Standby duty is cheaper in fuel because the running hours are few, but the set must still start and carry full load on demand, which is a different engineering problem. Generator power ratings explained covers how the classes map to running hours, and the fuel chart is the companion that turns those hours into litres. The two documents together answer the question a buyer really has: what does this set cost to keep running.
How Ambient Temperature and Altitude Add Fuel
The curve printed at sea level and 25°C is not the curve you get on a hot, high site. Yangzhou Tesla Power corrects every quotation for site altitude and temperature, because the uncorrected number is the one that fails on the first hot day. As the air thins or heats, the engine ingests less oxygen per stroke. It produces less power for the same fuel, and the cooling system works harder. The result is more litres per kWh for the same useful output.
The derate rules. Most diesel generator sets are rated at 40°C and a modest altitude. Push past either and the available power drops, often around 3–4% per 100m above 1000m and a few percent per 5°C above 40°C. The chart rarely shows this derate, so read it against the EU NRMM emission regulation 2016/1628 and the engine correction, not in isolation. A diesel in a high site loses available power before it burns a drop more fuel.
A site at 1500m and 45°C may see 10–12% less available power than the nameplate. The set then runs at a higher percentage of its reduced rating to do the same job. That higher percentage sits further right on the curve, where efficiency is still good. Altitude derating shows the step-by-step correction so the fuel estimate stays tied to the real site.
Read the Chart Before You Size the Fuel Tank
The tank volume comes straight from the burn and the refill interval, so the chart is the input, not an afterthought. Tesla Power sizes the tank from the worst-case burn rather than the typical average. A site that runs 24 h between fills needs a tank sized to the worst-case daily burn, or the first busy week stalls the set at the worst moment.
The tank multiplication. Take the 83 L/h figure from the 500kVA example and the three-day autonomy a remote site needs: 83 × 24 × 3 = 5,976 L of storage before the next fill. That single multiplication is why reading the chart early saves more money than any discount on the set, because the tank, the pad and the spill containment all scale with it. Under-sized autonomy is the most common mistake we see on export projects.
The refill interval is a logistics number, yet it dominates the tank. A city building with a daily fuel delivery needs far less storage than a mining camp reached by a slow road in the wet season. Fuel tank sizing walks the full duty-profile method, and the chart in this article is the first input that method consumes.
How a China Diesel Generator Supplier Presents the Data
A credible China diesel supplier publishes the fuel curve at the rated class, at the site altitude and temperature, and as litres per kWh at named load points. The conformity assessment for the export market should sit behind those numbers. Anything less is a placeholder, and a placeholder is what turns into a budget gap six months later. Treat a single round number with no load points as a red flag, not a convenience.
What an honest chart shows. It shows the per-kWh band across at least four load points. It names the engine and alternator. It states the test standard used to produce it, and the rating class up front, because the same hardware quoted as prime versus standby yields different allowable numbers. Independent diesel manufacturers who resist the curve are answering the question.
When the supplier resists sharing the as-tested curve, that resistance is the answer. Our Cummins-powered genset range carries the curve in the package. Transparency on fuel is the cheapest trust a supplier can offer, and the curve is where that trust starts.
Which Standards Govern the Numbers?
Three standards sit behind every honest fuel chart. The ISO 8528-1 rating definitions fix the rating classes. ISO 3046 fixes the reference site conditions for power and fuel correction. The NFPA 110 emergency power rule sets the acceptance test that proves the set can carry its rated load on demand. A chart that ignores all three is a sketch, not a specification. Tesla Power ties each quotation to these three standards so the number survives the buyer's own engineering review.
The acceptance test is where the per-kWh claim meets reality, because the set must start, accept load and hold it while the tester records the burn. Our help and advice pages collect the site records from these tests, including the common misreads of the fuel curve. Reading the standard alongside the chart is the difference between a number you can invoice against and a number you hope is right.
When Should You Request the Manufacturer's Fuel Curve?
Request the as-tested curve at the quotation stage, before the order, because it changes both the set size and the tank size. A buyer who asks only after delivery has already locked in a number they cannot challenge. The curve is a pre-sale document, not a post-sale apology. Tesla Power returns it at the quote stage so the buyer can still challenge the number.
A quote request that saves a week. Name the load profile, the site altitude and temperature, the rating class and the required litres per kWh at 25, 50, 75 and 100% load. That single line of detail removes the round-number guessing that costs a week of e-mail. kVA to kW conversion helps you state the load in the units the supplier tests against, which keeps the reply honest.
When the numbers come back, read them against this chart and the rating class before you sign. Request a fuel curve from our engineers and we will return the as-tested band for your site, not a generic average. That band is the number your finance team should carry into the budget, because it is the one the set will actually burn.
Frequently Asked Questions
It shows fuel burn at each load step, usually as litres per hour and as litres per kWh. The per-kWh figure is the efficiency you compare between sets, while the per-hour figure drives tank size and refill frequency. Read both at the load your site really carries.
Litres per hour rises with set size, so a big set can look thirstier even when it is more efficient. Litres per kWh removes the size effect and shows only how cleanly the engine burns, which is the fair way to compare two offers of different ratings.
Yes. Prime, standby and limited-run classes permit different loads and running hours, so the same hardware yields different allowable quoted figures. The ISO 8528-1 class must be stated with the number, or the comparison is meaningless.
Higher altitude and temperature thin the air, so the engine makes less power for the same fuel and the available rating drops. The litres per hour may stay similar, but you get fewer kilowatts for them, which raises the effective cost per useful kilowatt-hour.
No. Size the tank from the worst-case daily burn at peak load and the longest refill interval, not the typical average. Under-sized autonomy causes a stall during the first busy week, which is far costlier than a slightly larger tank.
Ask for the as-tested fuel curve at your rating class, site altitude and temperature, stated as litres per kWh at 25, 50, 75 and 100% load. A supplier who will not share the curve is telling you the number is not one you can invoice against.
Emission regulations such as the EU NRMM rule 2016/1628 shape the engine calibration, which influences the burn band. The chart itself stays a fuel document, but the compliant calibration is the reason two similar sets can show different curves.
Re-check it at every repower, after a major injector or turbo change, and when the duty profile shifts. The curve is a tested snapshot of one configuration, so any change to that configuration can move the numbers you budget against.
Reading the chart before you buy turns fuel from a surprise into a line item, and that line item is what protects the budget for the life of the set. Tesla Power's engineering team returns the as-tested curve for your site on every quotation, so the litres per kWh you plan with are the litres the set will burn.